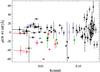
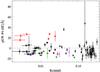
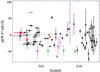
Fig. 9
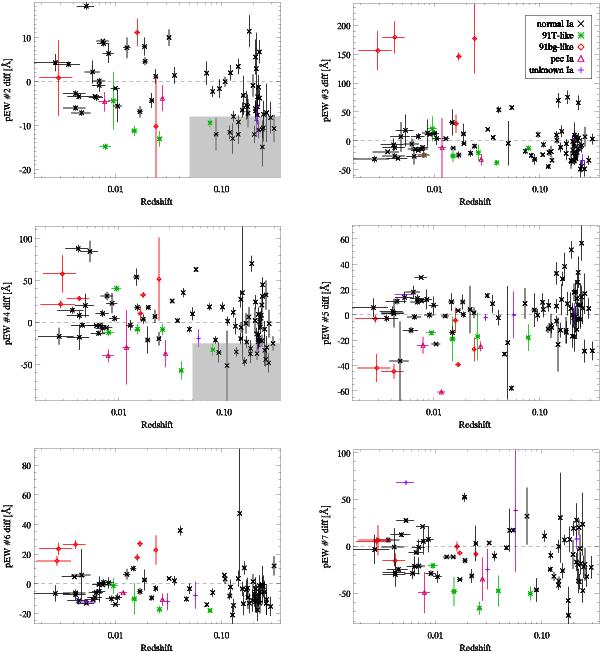
Comparison of the pseudo-equivalent width measurements around lightcurve peak for features 2 to 7 vs. redshift. In all figures the average spectroscopic evolution among non-peculiar low-z reference SNe has been subtracted. It is thus the pEW-difference (compared to normal low-z SNe) that is plotted on the y-axis. SNe are divided according to subtype classification, with the colour scheme following the legend in the upper right plot. In the two upper left panels (f2 and f4) the shaded region show how the pEW-deficit sample is defined.
Current usage metrics show cumulative count of Article Views (full-text article views including HTML views, PDF and ePub downloads, according to the available data) and Abstracts Views on Vision4Press platform.
Data correspond to usage on the plateform after 2015. The current usage metrics is available 48-96 hours after online publication and is updated daily on week days.
Initial download of the metrics may take a while.