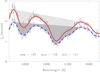
Fig. 5
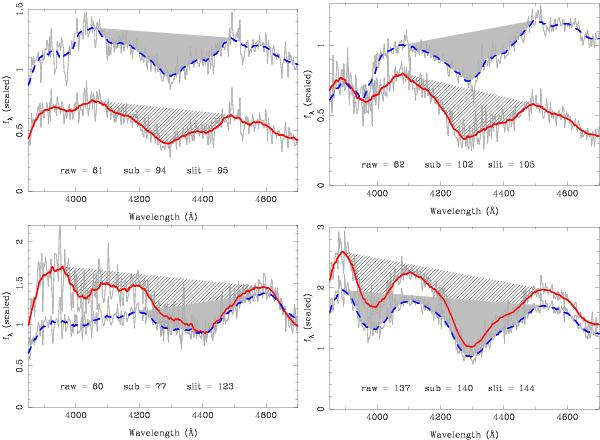
Expanded view of the feature 3 region for the same spectra displayed in Fig. 4, showing the effects of host subtraction and slit loss/reddening correction on pEW. Wavelength (x-axis) is rest-frame wavelength. The blue dashed line is the raw spectrum, the red solid line the final subtracted and corrected spectrum. The marked regions show where pEW is calculated, the calculated pEWs (in Å) are written in panels for raw spectra (“raw”), subtracted spectra (“sub”) as well as subtracted and corrected spectra (“slit”). These sample spectra show host subtraction change pEWs both through additive offsets and changed feature limits.
Current usage metrics show cumulative count of Article Views (full-text article views including HTML views, PDF and ePub downloads, according to the available data) and Abstracts Views on Vision4Press platform.
Data correspond to usage on the plateform after 2015. The current usage metrics is available 48-96 hours after online publication and is updated daily on week days.
Initial download of the metrics may take a while.