Fig. 4
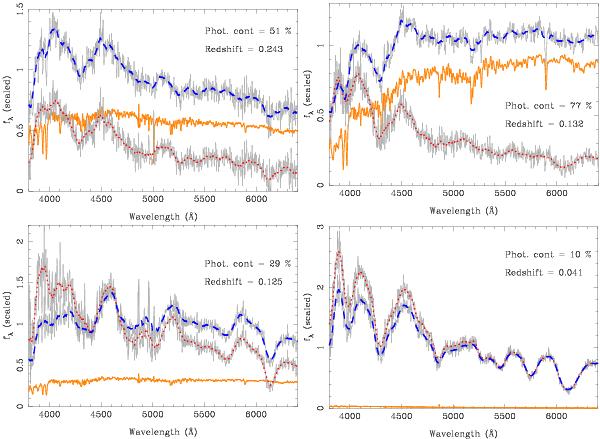
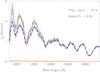
Display of sample host galaxy subtractions of SDSS SN16637, 12907, 17886 and 13894 (clockwise from top left, restframe epochs −1, 0, −4 and 9). All flux values (y-axis) have been scaled. Wavelength (x-axis) is rest-frame wavelength. The grey line shows the unsmoothed original spectrum, while the dashed blue line shows the smoothed version. Dotted red line show final subtracted slit loss/reddening corrected spectrum and orange solid line show best fit galaxy. Note that because of the slit loss/reddening correction the galaxy and subtracted spectrum do not sum to the raw spectrum. The galaxy contamination estimated from photometry (g-band) and redshift have been written in each panel.
Current usage metrics show cumulative count of Article Views (full-text article views including HTML views, PDF and ePub downloads, according to the available data) and Abstracts Views on Vision4Press platform.
Data correspond to usage on the plateform after 2015. The current usage metrics is available 48-96 hours after online publication and is updated daily on week days.
Initial download of the metrics may take a while.