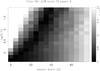
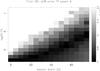
Fig. B.1

Average pEW error for feature 3 (left panel) and feature 7 (right panel) at the epoch of maximum light. The noise level, expressed through the logarithm of the pseudo-S/N, increases along the y-axis and the filter strength along the x-axis. Darker shades show smaller errors.
Current usage metrics show cumulative count of Article Views (full-text article views including HTML views, PDF and ePub downloads, according to the available data) and Abstracts Views on Vision4Press platform.
Data correspond to usage on the plateform after 2015. The current usage metrics is available 48-96 hours after online publication and is updated daily on week days.
Initial download of the metrics may take a while.