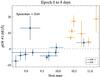
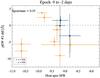
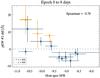
Fig. 14
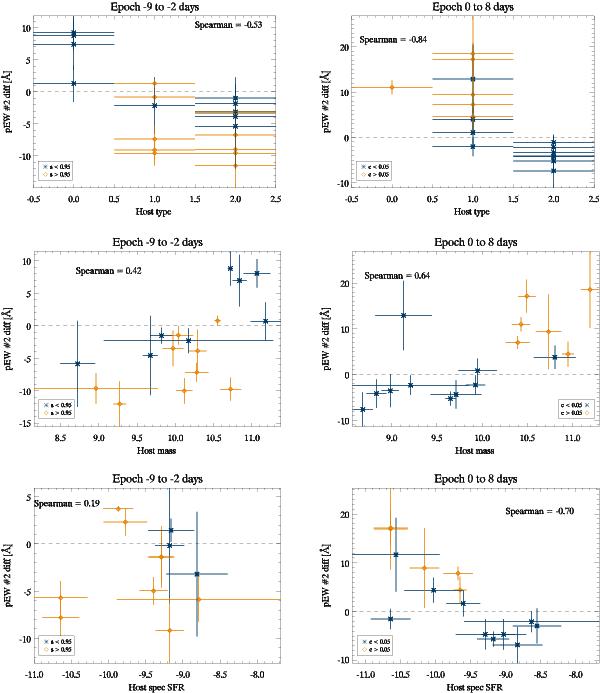
Pseudo equivalent width of feature 2 compared with host galaxy properties. Left panels: pre peak epochs (−9 to 2) with colours marking low/high lightcurve stretch SNe. Right panels: post peak epochs (0 to 8) with colours marking low/high lightcurve colour SNe. Top: host type vs. pEW (0 not star forming, 1 moderately star forming, 2 highly star forming. Middle: Log of Host galaxy mass (M⊙) vs. pEW. Bottom: Log specific start formation rate (log sSFR, yr-1) vs. pEW.
Current usage metrics show cumulative count of Article Views (full-text article views including HTML views, PDF and ePub downloads, according to the available data) and Abstracts Views on Vision4Press platform.
Data correspond to usage on the plateform after 2015. The current usage metrics is available 48-96 hours after online publication and is updated daily on week days.
Initial download of the metrics may take a while.