Fig. 13
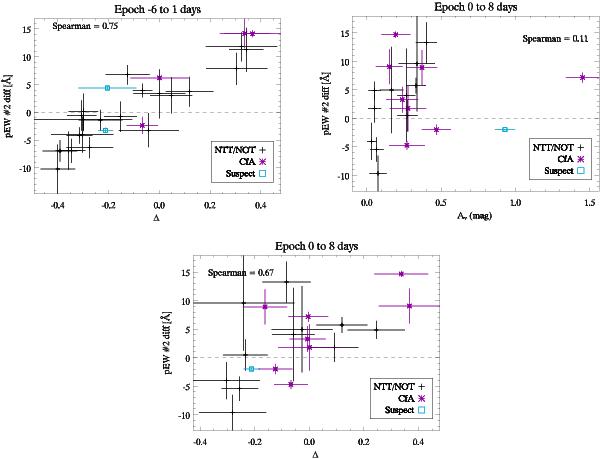
These correlation studies show ΔpEW, the measured pEW minus the expected pEW (for the corresponding epoch for the full sample of normal SNe Ia), vs. MLCS2k2 lightcurve parameter (Δ, AV) for different epoch intervals. These are given above each panel. The Spearman correlation coefficient is given in each plot. The epoch ranges were chosen to correspond to those used in Fig. 12. For the post lightcurve peak epoch range (0−8) we include correlations with both Δ and AV.
Current usage metrics show cumulative count of Article Views (full-text article views including HTML views, PDF and ePub downloads, according to the available data) and Abstracts Views on Vision4Press platform.
Data correspond to usage on the plateform after 2015. The current usage metrics is available 48-96 hours after online publication and is updated daily on week days.
Initial download of the metrics may take a while.