Fig. 4
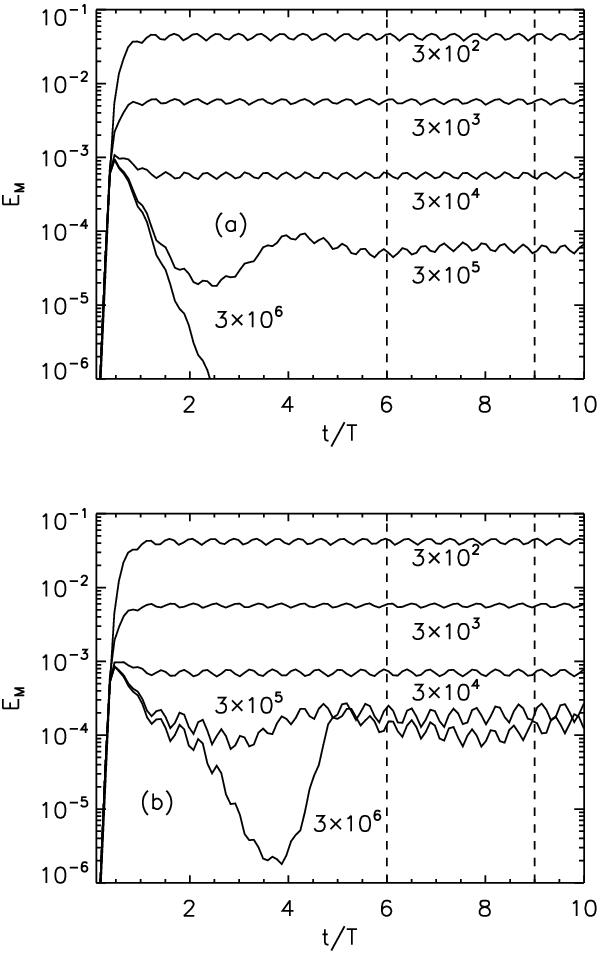
a) Time series of EM for U0 = 0 and vamp = 0, i.e. no wind or circulation, for 5 different values of ReM. b) The corresponding plot with U0 = 1, w = 0.3 and vamp = 75. The time-averaged magnetic energy ⟨ EM ⟩ t is calculated by time-averaging these time-series between the two dashed vertical lines. The other parameters used are α0 = 16, wα = 0.2, r2 = 1.5, and w = 0.3.
Current usage metrics show cumulative count of Article Views (full-text article views including HTML views, PDF and ePub downloads, according to the available data) and Abstracts Views on Vision4Press platform.
Data correspond to usage on the plateform after 2015. The current usage metrics is available 48-96 hours after online publication and is updated daily on week days.
Initial download of the metrics may take a while.