Fig. 8
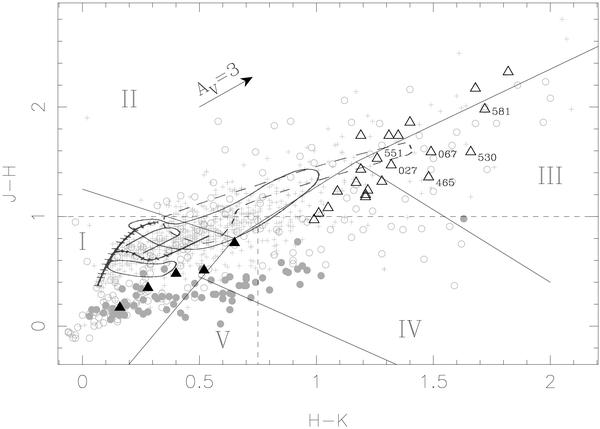
Near-IR color–color diagram indicating the regions for different categories of objects defined by GL97 (separated by thin full lines), Siódmiak et al. (2008 – thin dashed lines), and Bessell & Brett (1988 – thick lines). Triangles are used to show our stars and gray circles represent very likely post-AGBs from the Toruń Catalog. Double-peak SEDs are indicated by filled symbols (post-AGBs class IV). Gray crosses represent the HAeBe stars from HBC.
Current usage metrics show cumulative count of Article Views (full-text article views including HTML views, PDF and ePub downloads, according to the available data) and Abstracts Views on Vision4Press platform.
Data correspond to usage on the plateform after 2015. The current usage metrics is available 48-96 hours after online publication and is updated daily on week days.
Initial download of the metrics may take a while.