Fig. 7
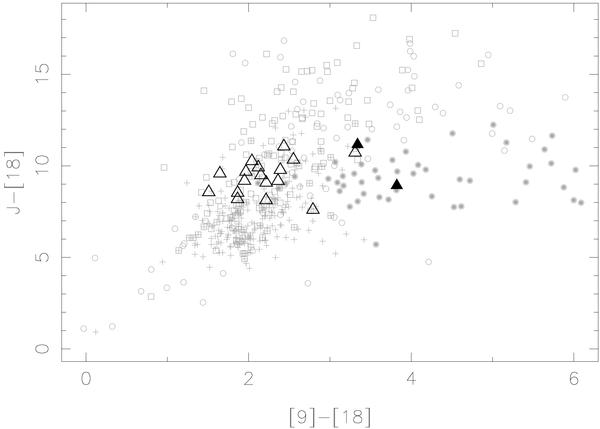
Mid-IR color–color diagram based on AKARI fluxes. Triangles indicate our sample and gray circles represent the very likely post-AGBs from the Toruń Catalog. Filled symbols are used for objects having double peaks in the SED, while open symbols represent single peaks. The distribution of young objects is shown by gray squares (YSOs detected by Spitzer) and gray crosses (HAeBe stars from HBC).
Current usage metrics show cumulative count of Article Views (full-text article views including HTML views, PDF and ePub downloads, according to the available data) and Abstracts Views on Vision4Press platform.
Data correspond to usage on the plateform after 2015. The current usage metrics is available 48-96 hours after online publication and is updated daily on week days.
Initial download of the metrics may take a while.