Free Access
Fig. 3
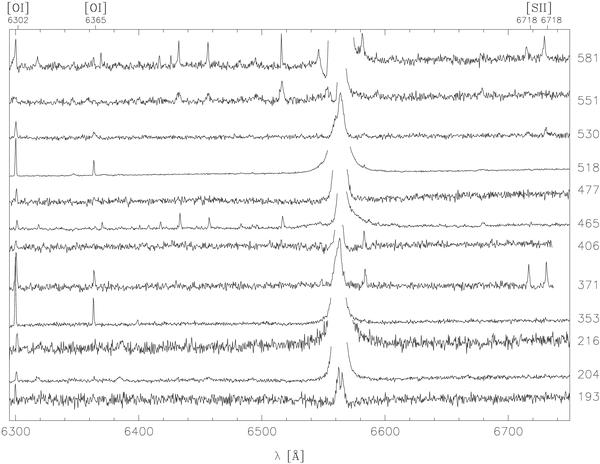
Optical spectra of part of the sample, identified by the PDS number in the right side. The Hα feature is not shown in order to enhance details of other emission lines. Intensity scale is arbitrary.
Current usage metrics show cumulative count of Article Views (full-text article views including HTML views, PDF and ePub downloads, according to the available data) and Abstracts Views on Vision4Press platform.
Data correspond to usage on the plateform after 2015. The current usage metrics is available 48-96 hours after online publication and is updated daily on week days.
Initial download of the metrics may take a while.