Free Access
Fig. 1
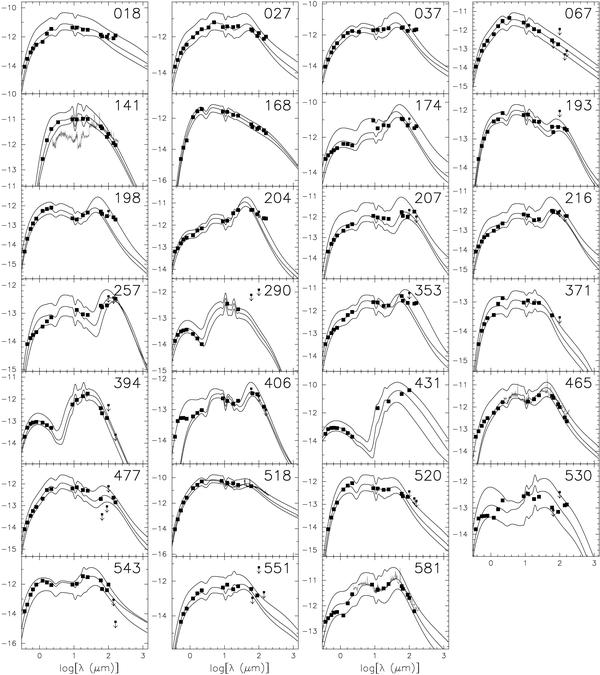
Observed SED of our sample showing log(λFλ in [W m-2] vs. log(λ) in [μm]. Filled squares represent optical photometry, 2MASS, AKARI, MSX and IRAS data, while dots are used to plot ISO spectra. Solid curves indicate the variation in the calculated SED.
Current usage metrics show cumulative count of Article Views (full-text article views including HTML views, PDF and ePub downloads, according to the available data) and Abstracts Views on Vision4Press platform.
Data correspond to usage on the plateform after 2015. The current usage metrics is available 48-96 hours after online publication and is updated daily on week days.
Initial download of the metrics may take a while.