Fig. 7
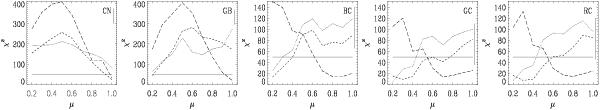
χ2 values for histograms of convolved simulations as shown in Fig. 5 but for all the limb angles μ = 0.2−1.0. The χ2 values for 0 G, 50 G, and 200 G are represented by dotted, dashed, and long-dashed lines, respectively. The Δχ2 for a confidence level of 99% is 75 for 50 bins. A Δχ2 of 75 is indicated by the solid line on the right of each plot. The grey line at χ2 = 49 indicates the level where  .
.
Current usage metrics show cumulative count of Article Views (full-text article views including HTML views, PDF and ePub downloads, according to the available data) and Abstracts Views on Vision4Press platform.
Data correspond to usage on the plateform after 2015. The current usage metrics is available 48-96 hours after online publication and is updated daily on week days.
Initial download of the metrics may take a while.