Fig. 6
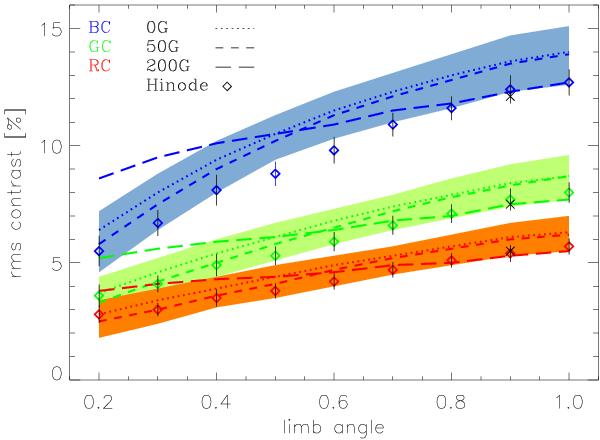
RMS contrasts for the BC, GC, and RC Hinode/SOT wavelengths at the limb angles μ = 0.2−1.0 for the mean over the 0 G simulation snapshots (dotted lines), the 50 G simulation snapshots (dashed line), the 200 G simulation snapshots (long dashes), and the Hinode dataset II observations (diamonds). We show the spread in the ten snapshots of the 50 G simulation and overplot the 1σ error of the Hinode dataset II observations. Overplotted (black crosses) are the Hinode dataset I results at μ = 0.9, which are almost indistinguishable from the dataset II results.
Current usage metrics show cumulative count of Article Views (full-text article views including HTML views, PDF and ePub downloads, according to the available data) and Abstracts Views on Vision4Press platform.
Data correspond to usage on the plateform after 2015. The current usage metrics is available 48-96 hours after online publication and is updated daily on week days.
Initial download of the metrics may take a while.