Fig. 5
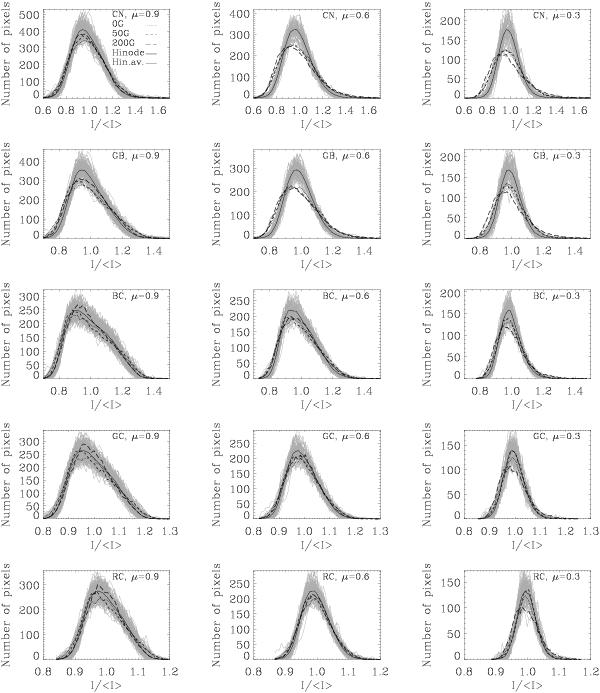
Histograms of the intensity distribution in convolved simulations and in observations for the five Hinode/SOT wavelengths, from top to bottom: 388 nm, 430 nm, 450 nm, 555 nm, and 668 nm. From left to right: Limb angles μ = 0.9, μ = 0.6, μ = 0.3. The histograms for the simulations are shown for three different magnetic fluxes: 0 G (dotted), 50 G (dashed), and 200 G (long dashes). To illustrate the spread in the observations, we overplot histograms of extracts of the whole observed image (grey lines). The black solid line indicates the mean over all observed extracts. Note the different scales in the horizontal axes.
Current usage metrics show cumulative count of Article Views (full-text article views including HTML views, PDF and ePub downloads, according to the available data) and Abstracts Views on Vision4Press platform.
Data correspond to usage on the plateform after 2015. The current usage metrics is available 48-96 hours after online publication and is updated daily on week days.
Initial download of the metrics may take a while.