Fig. 3
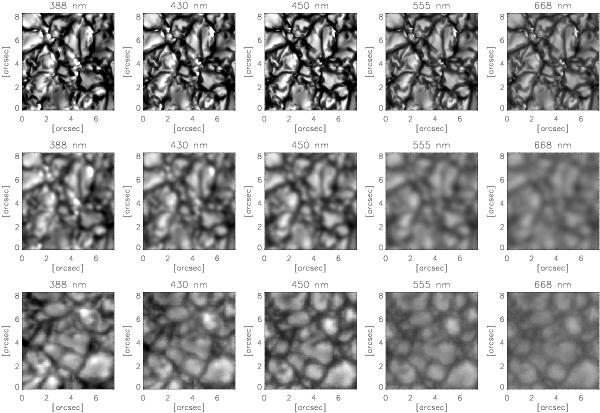
Simulations (original and convolved) and observations in the five Hinode/SOT filters. Top: Original simulation snapshots with an input magnetic field of 50 G. Black: 52% below the mean, white: 68% above the mean value. Middle: Same simulation snapshots convolved with an appropriate point-spread function (PSF). Bottom: Extracts from observed image. The black/white scale for the convolved simulations and the observations is such that black is 33% below the mean, and white is 40% above the mean value.
Current usage metrics show cumulative count of Article Views (full-text article views including HTML views, PDF and ePub downloads, according to the available data) and Abstracts Views on Vision4Press platform.
Data correspond to usage on the plateform after 2015. The current usage metrics is available 48-96 hours after online publication and is updated daily on week days.
Initial download of the metrics may take a while.