Fig. 2
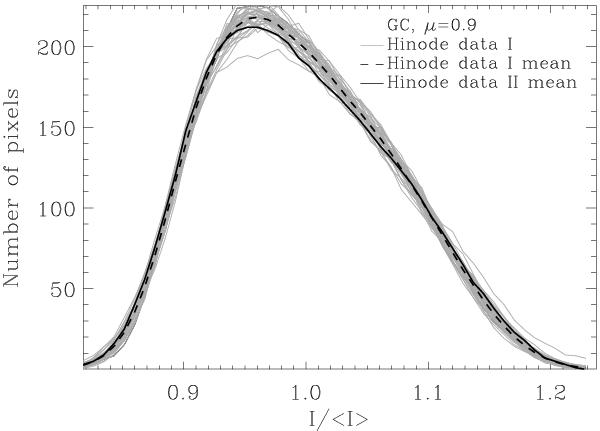
Comparison of Hinode datasets I (Mercury transit) and II for the green continuum wavelength at the limb angle μ = 0.9. For dataset I, we plot 37 histograms where each includes ten random extracts of the whole observed image (grey lines) and the mean histogram (solid line). We overplot the mean of the analogous quantity for dataset II (black dashed line).
Current usage metrics show cumulative count of Article Views (full-text article views including HTML views, PDF and ePub downloads, according to the available data) and Abstracts Views on Vision4Press platform.
Data correspond to usage on the plateform after 2015. The current usage metrics is available 48-96 hours after online publication and is updated daily on week days.
Initial download of the metrics may take a while.