Fig. 2
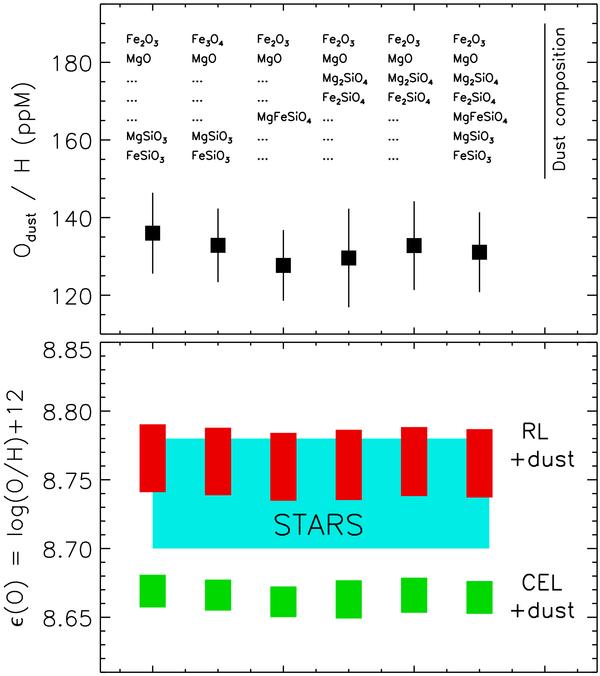
Upper panel: amount of oxygen expected to be in solid form for various dust composition scenarios (see Table 6). Lower panel: comparison of the stellar oxygen abundance (wide cyan rectangle) with the gas+dust oxygen abundance in the nebula for the different dust scenarios. Green rectangles are obtained with CEL gas abundances, red rectangles are obtained with RL gas abundances. See text for an explanation of the considered uncertainties.
Current usage metrics show cumulative count of Article Views (full-text article views including HTML views, PDF and ePub downloads, according to the available data) and Abstracts Views on Vision4Press platform.
Data correspond to usage on the plateform after 2015. The current usage metrics is available 48-96 hours after online publication and is updated daily on week days.
Initial download of the metrics may take a while.