Fig. 1
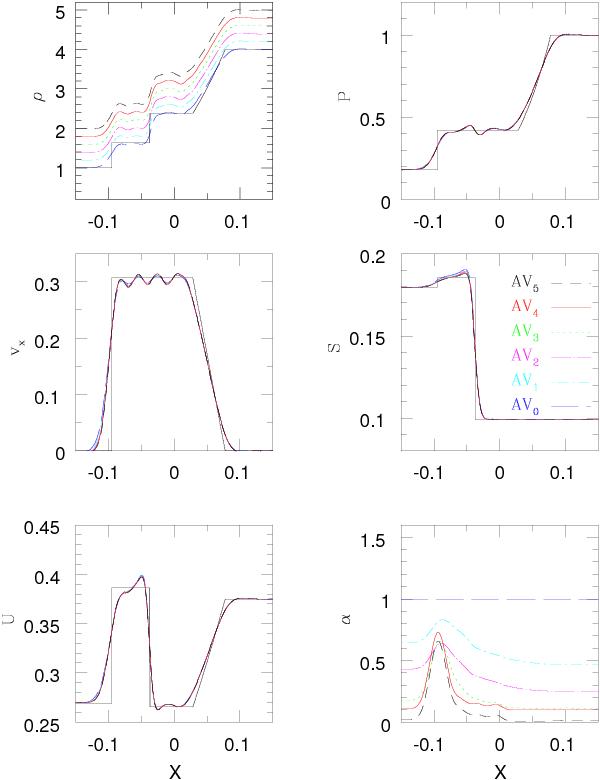
Results at t = 0.12 from the shock tube test for 3D SPH runs with different AV parameters. The profiles are projected along the shock front. From top to bottom are plotted: density, velocity, and thermal energy (left column); pressure, entropy, and viscosity parameter (right column). The solid black line represents the analytical solution, while lines with different styles and colors are the profiles of the SPH runs with different AV parameters. Different runs are labeled according to Table 1 and the relationship with the corresponding profiles is illustrated in the entropy panel. In the density panel, profiles of different runs have been shifted vertically to more clearly illustrate their relative differences.
Current usage metrics show cumulative count of Article Views (full-text article views including HTML views, PDF and ePub downloads, according to the available data) and Abstracts Views on Vision4Press platform.
Data correspond to usage on the plateform after 2015. The current usage metrics is available 48-96 hours after online publication and is updated daily on week days.
Initial download of the metrics may take a while.