Fig. 4
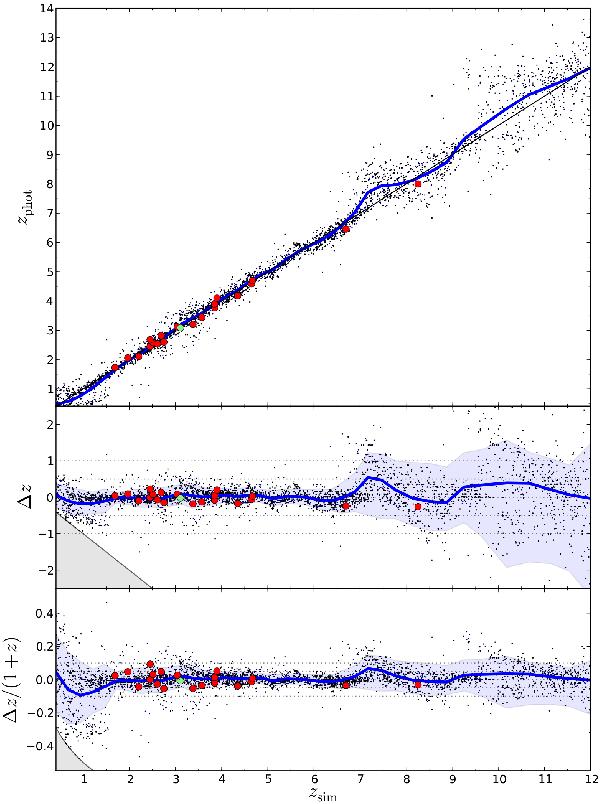
Photometric redshift accuracy. Small black dots show the mock set of simulated afterglow spectra and their corresponding photo-z. Thick blue lines show the average photometric redshift after distributing the 4000 mock afterglows into redshift bins of 100 afterglows each. The lowest two panels also show in blue-shaded areas the quadratic sum of the typical difference to the input redshift and the 1σ statistical uncertainty of the photo-z analysis averaged over 100 afterglows in absolute (Δz = zphot − zsim) as well as relative (η = Δz/(1 + z)) terms. The statistical probability that the true value is in the interval of +/−20% around the quoted 1σ accuracy is >95%. Grey shaded areas represent the zphot > 0 constraint. The thin, horizontal, dotted lines in the lowest two panels represent Δz = −0.1,−0.05,0, +0.05, +0.10 and η = Δz/(1 + z) = −0.1,−0.05,0, +0.05 and +0.10. The large red dots show final UVOT/GROND photo-z measurements for real bursts where a spectroscopic redshift has been obtained (see Table 1). The green dot shows the photo-z of the flat-spectrum radio quasar PKS 0537-286 derived in a similar manner (z = 3.10; Bottacini et al. 2010; Wright et al. 1978).
Current usage metrics show cumulative count of Article Views (full-text article views including HTML views, PDF and ePub downloads, according to the available data) and Abstracts Views on Vision4Press platform.
Data correspond to usage on the plateform after 2015. The current usage metrics is available 48-96 hours after online publication and is updated daily on week days.
Initial download of the metrics may take a while.