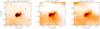
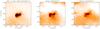
Fig. 2

From left to right: XRT and EUVI A and B images. The top row shows the images before the first micro-flare took place, while the bottom row presents the images taken seconds after it happened. The arrows point at the region where the micro-flare (surrounded by a circle) occurred. The XRT image (top left) is superimposed with the magnetic field contours at levels −100, −50, 50 and 100 G obtained from the magnetogram at 00:01:01 UT.
Current usage metrics show cumulative count of Article Views (full-text article views including HTML views, PDF and ePub downloads, according to the available data) and Abstracts Views on Vision4Press platform.
Data correspond to usage on the plateform after 2015. The current usage metrics is available 48-96 hours after online publication and is updated daily on week days.
Initial download of the metrics may take a while.