Fig. 16
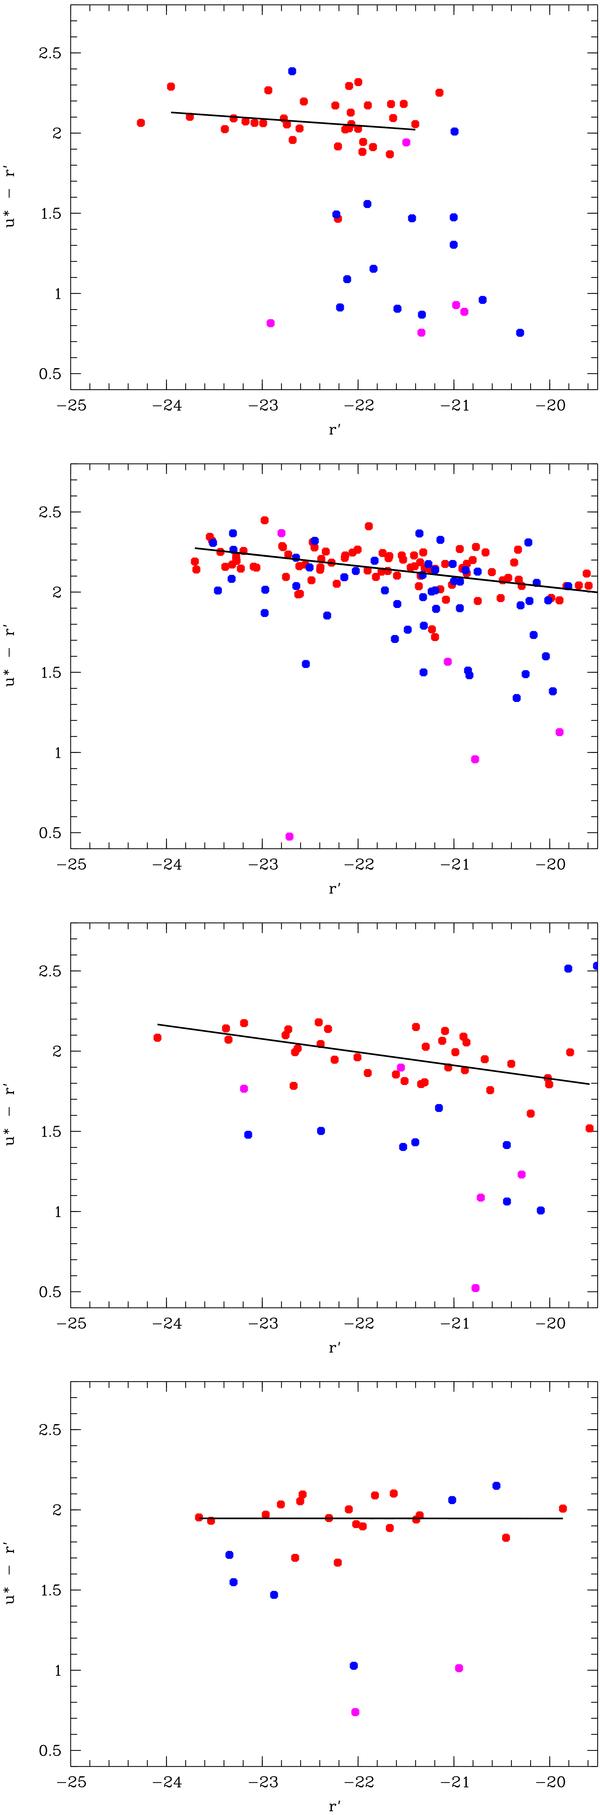
Rest frame u∗ − r′ versus absolute r′ magnitude relation for clusters using spectroscopic redshifts to compute absolute magnitudes. We only plot cluster members in these figures. From top to bottom, figures are for the most luminous, the luminous, the moderately luminous, and the C0 clusters. Red symbols correspond to early-type galaxies (T ≤ 21), blue symbols correspond to late-type non-starburst galaxies (58 ≥ T ≥ 21), and pink symbols correspond to starburst galaxies (T ≥ 59). Black continuous lines are computed using only T ≤ 21 galaxies (see Table 6).
Current usage metrics show cumulative count of Article Views (full-text article views including HTML views, PDF and ePub downloads, according to the available data) and Abstracts Views on Vision4Press platform.
Data correspond to usage on the plateform after 2015. The current usage metrics is available 48-96 hours after online publication and is updated daily on week days.
Initial download of the metrics may take a while.