Free Access
Fig. 5
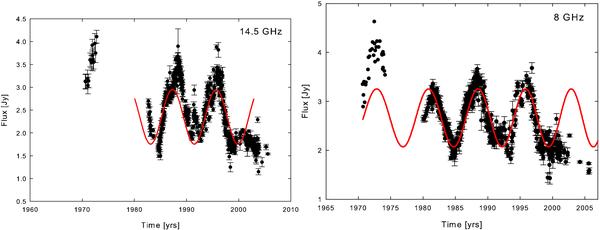
Total flux-density light curves of B0605−085 at 14.5 GHz and 8 GHz. The red line shows sinusoids derived from the date-compensated Fourier transform method with periods of 8.4 and 7.9 years respectively.
This figure is made of several images, please see below:
Current usage metrics show cumulative count of Article Views (full-text article views including HTML views, PDF and ePub downloads, according to the available data) and Abstracts Views on Vision4Press platform.
Data correspond to usage on the plateform after 2015. The current usage metrics is available 48-96 hours after online publication and is updated daily on week days.
Initial download of the metrics may take a while.