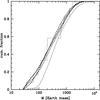
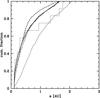
Fig. 8

Cumulative histograms of minimum mass (left) and semi-major axis (right) of synthetic and observable planets around M stars. In each case, we only take into account planets whose induced Doppler semi-amplitude is larger than 10 m/s, and periods shorter than 3 years. Moreover, we exclude planets located at distances closer than 0.1 AU (the internal limit of our computational disk). For synthetic planets (heavy lines), we used the formation model around 0.5 M⊙ stars, whereas we selected planets discovered around stars with masses between 0.3M⊙ and 0.8M⊙ (step-like lines). The three heavy lines represent the formation model around a 0.5M⊙ star for αD equal to 1.2 (solid line), 0 (dotted line), and 2 (dashed line). The thin solid line is for a primary mass of 1.0 M⊙. The results of a statistical comparison between the different curves is indicated in Table 3.
Current usage metrics show cumulative count of Article Views (full-text article views including HTML views, PDF and ePub downloads, according to the available data) and Abstracts Views on Vision4Press platform.
Data correspond to usage on the plateform after 2015. The current usage metrics is available 48-96 hours after online publication and is updated daily on week days.
Initial download of the metrics may take a while.