Free Access
Fig. 5
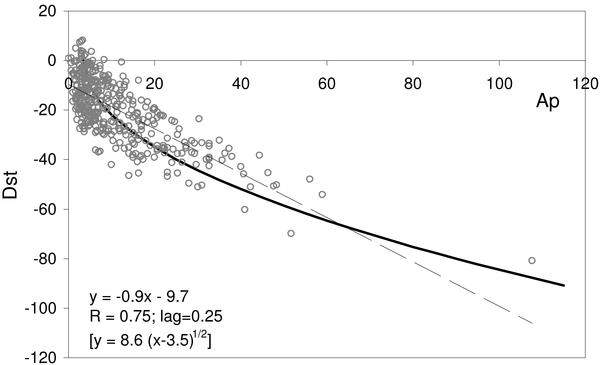
Correlation between Dst and Ap, where Dst is delayed by 0.25 days. Parameters of the linear least square fit (dashed line) are given in the inset. Bold curve represents the function  .
.
Current usage metrics show cumulative count of Article Views (full-text article views including HTML views, PDF and ePub downloads, according to the available data) and Abstracts Views on Vision4Press platform.
Data correspond to usage on the plateform after 2015. The current usage metrics is available 48-96 hours after online publication and is updated daily on week days.
Initial download of the metrics may take a while.