Fig. 4
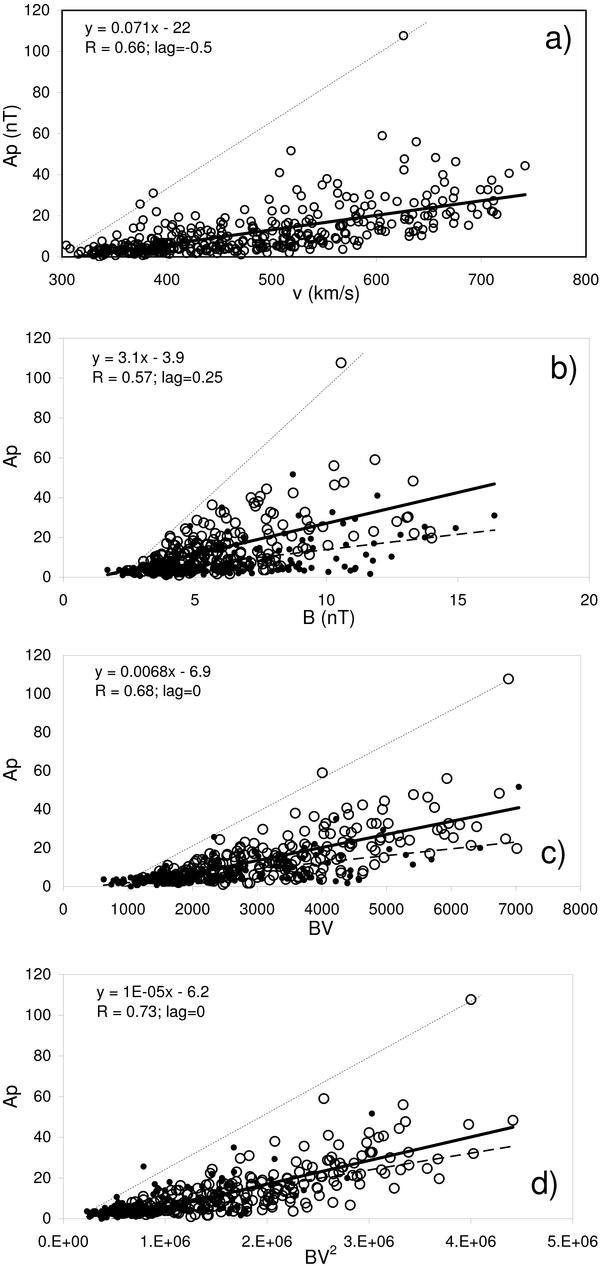
Correlations V–Ap, B–Ap, BV–Ap, and BV2 − Ap. In panels b) − d) we separated the data points characterized by v > 450 km s-1 (circles), from those having v < 450 km s-1 (black dots). The linear least squares fit parameters, the correlation coefficient R, and the applied time lag Δt are presented in the insets; in panels b) − d), the fit parameters are for the v > 450 km s-1 data (bold line). Dashed lines are fits for the v < 450 km s-1 data; dotted lines represent an estimate of the upper limit.
Current usage metrics show cumulative count of Article Views (full-text article views including HTML views, PDF and ePub downloads, according to the available data) and Abstracts Views on Vision4Press platform.
Data correspond to usage on the plateform after 2015. The current usage metrics is available 48-96 hours after online publication and is updated daily on week days.
Initial download of the metrics may take a while.