Fig. 2
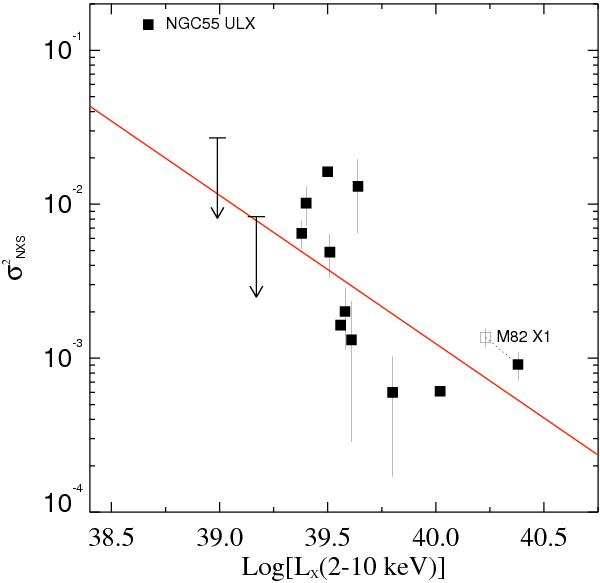
Normalised excess variance versus log(L2−10 keV)
for the ULXs. Arrows indicate the 90% confidence upper limits on
 for the
sources with negative excess variance estimates. The point plotted with an empty
square indicates the M 82 X−1 measurement when corrected for the contribution of
X42.3+59 to the observed count rate (see text for details). The shift of M 82 X−1
is shown as a dotted line. The solid line indicates the best fit to the data
(excluding NGC 55 ULX).
for the
sources with negative excess variance estimates. The point plotted with an empty
square indicates the M 82 X−1 measurement when corrected for the contribution of
X42.3+59 to the observed count rate (see text for details). The shift of M 82 X−1
is shown as a dotted line. The solid line indicates the best fit to the data
(excluding NGC 55 ULX).
Current usage metrics show cumulative count of Article Views (full-text article views including HTML views, PDF and ePub downloads, according to the available data) and Abstracts Views on Vision4Press platform.
Data correspond to usage on the plateform after 2015. The current usage metrics is available 48-96 hours after online publication and is updated daily on week days.
Initial download of the metrics may take a while.