Free Access
Fig. 10
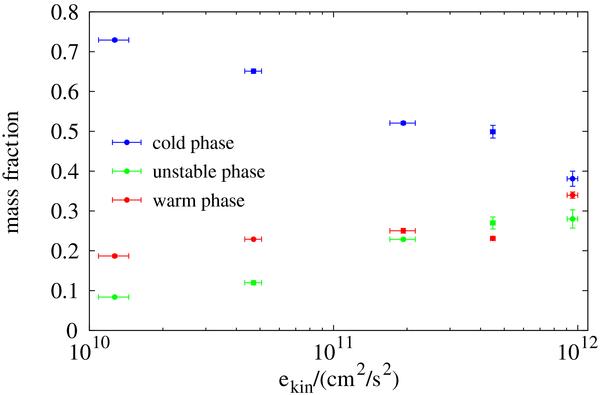
Time-averaged mass fractions of the warm (red points), unstable (green points), and cold phase (blue points) for simulations with n0 = 1.0 cm-3 and N = 2563 plotted against the specific kinetic energy. An increasing kinetic energy corresponds to an increase in the forcing Mach number (compare Table 1).
Current usage metrics show cumulative count of Article Views (full-text article views including HTML views, PDF and ePub downloads, according to the available data) and Abstracts Views on Vision4Press platform.
Data correspond to usage on the plateform after 2015. The current usage metrics is available 48-96 hours after online publication and is updated daily on week days.
Initial download of the metrics may take a while.