Fig. 9
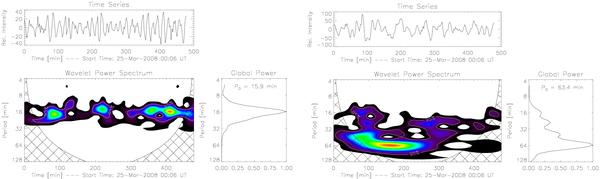
25 March 2008 case. Top: typical time series of the relative intensity at a fixed slit position. The approximate window size of the equivalent weighted running average to obtain the background is 22 min (left) and 96 min (right). Bottom colored panels: wavelet power spectrum. The hatched area is below the 95% confidence-level line, and the related data are not reliable. The time-integrated total power (normalized) versus time in minutes is shown to the right of the colored panels. Note that the maximum power peak occurs at a period of ~16 min (left) and ~64 min (right).
Current usage metrics show cumulative count of Article Views (full-text article views including HTML views, PDF and ePub downloads, according to the available data) and Abstracts Views on Vision4Press platform.
Data correspond to usage on the plateform after 2015. The current usage metrics is available 48-96 hours after online publication and is updated daily on week days.
Initial download of the metrics may take a while.