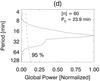
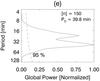
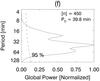
Fig. 8
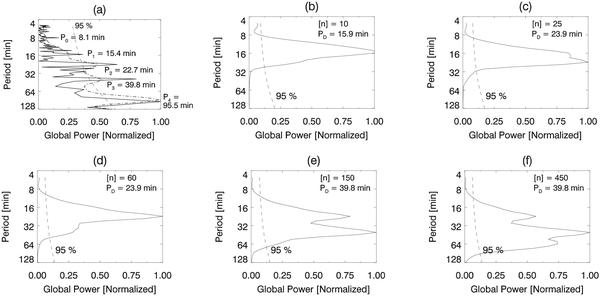
Panel a): normalized global power (NGP) of the existing periodicities in a typical time series as obtained from the wavelet-based analysis (dot-dashed line), and the Lomb-Normalized periodogram (continuous line). Pi indicates the value in minutes of the most significant periods. All labeled peaks have less than 0.01% probability of being due to white noise. Panels b) through f): NGP from the wavelet-based analysis to show how the determination of the background affects the relative intensity of a given period. The number of iterations [n] performed to obtain the different background trends is indicated on each panel along with the value of the dominant period PD. The dashed line in all panels indicates the 95% confidence level for the wavelet-based method. For details see Sect. 3.3. The example shown corresponds to a time series obtained for the slit at the location depicted as A in Fig. 4 at a distance from the slit origin of 36 000 km (on 2008/03/25).
Current usage metrics show cumulative count of Article Views (full-text article views including HTML views, PDF and ePub downloads, according to the available data) and Abstracts Views on Vision4Press platform.
Data correspond to usage on the plateform after 2015. The current usage metrics is available 48-96 hours after online publication and is updated daily on week days.
Initial download of the metrics may take a while.