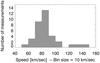
Fig. 7
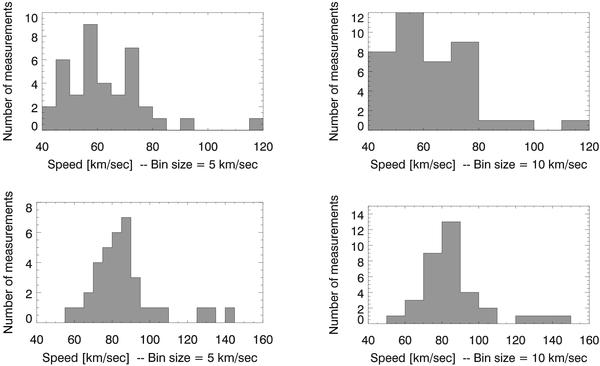
Histograms of the speeds inferred from the four maps shown in Fig. 5, for the 2007/08/23 case (two top frames) and 2008/03/25 case (two bottom frames), with an average value of (63 ± 2) km s-1 (corrected by projection effects) and (86 ± 3) km s-1, respectively. The two corresponding histograms for each case refer to bin sizes of 5 km s-1 (left) and 10 km s-1 (right), respectively.
Current usage metrics show cumulative count of Article Views (full-text article views including HTML views, PDF and ePub downloads, according to the available data) and Abstracts Views on Vision4Press platform.
Data correspond to usage on the plateform after 2015. The current usage metrics is available 48-96 hours after online publication and is updated daily on week days.
Initial download of the metrics may take a while.