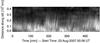
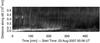
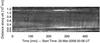
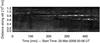
Fig. 5
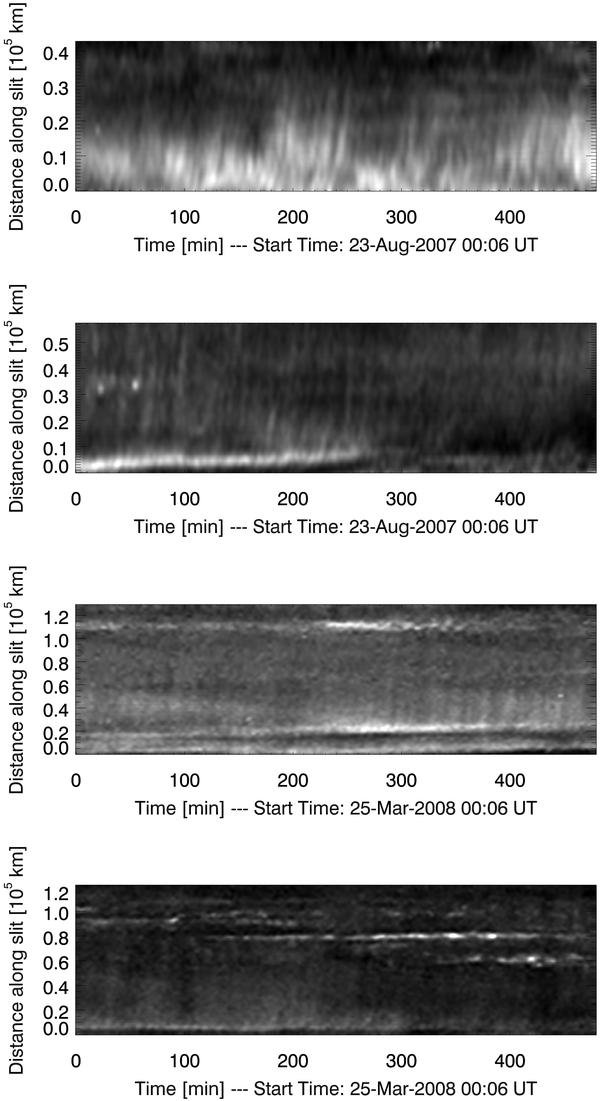
Distance-Time maps: intensity along the slit as function of time. This presentation is apt to reveal propagating features appearing as coherent structures in the hodograms of this map. The maps are obtained with the slits located as depicted in white in Fig. 3 (anemone-like region on 2007/08/23) on the top two panels, and in Fig. 4 (NOAA AR 10987 on 2008/03/25) on the two bottom ones, respectively.
Current usage metrics show cumulative count of Article Views (full-text article views including HTML views, PDF and ePub downloads, according to the available data) and Abstracts Views on Vision4Press platform.
Data correspond to usage on the plateform after 2015. The current usage metrics is available 48-96 hours after online publication and is updated daily on week days.
Initial download of the metrics may take a while.