Fig. 4
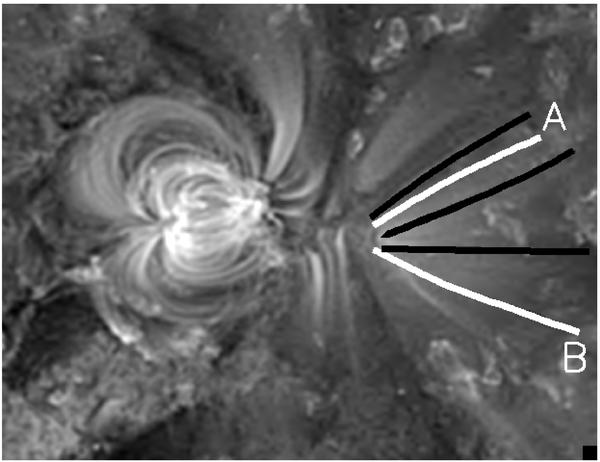
Fe ix,x Intensity map of the NOAA AR 10987 and surroundings from STEREO B on 2008/03/25 at 00:06 UT. The black and white lines show the slits defined along particular structures. The corresponding intensities along these slits as function of time are shown in Fig. 5, where the path denoted as A corresponds to the second map from the bottom, and B corresponds to the last one.
Current usage metrics show cumulative count of Article Views (full-text article views including HTML views, PDF and ePub downloads, according to the available data) and Abstracts Views on Vision4Press platform.
Data correspond to usage on the plateform after 2015. The current usage metrics is available 48-96 hours after online publication and is updated daily on week days.
Initial download of the metrics may take a while.