Fig. 11
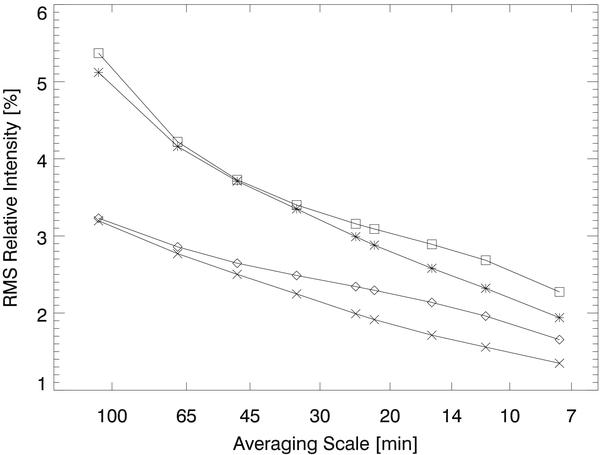
Inferred wave amplitude for the four hodogram panels shown in Fig. 5. The root-mean-square relative line intensity is given versus the equivalent length (in logarithmic units) of the equivalent averaging window in minutes. The squares corresponds to path A, and the asterisks to path B in Fig. 3 for the 23 August 2007 case. The diamonds corresponds to path A, and the crosses to path B in Fig. 4 for the 25 March 2008 case.
Current usage metrics show cumulative count of Article Views (full-text article views including HTML views, PDF and ePub downloads, according to the available data) and Abstracts Views on Vision4Press platform.
Data correspond to usage on the plateform after 2015. The current usage metrics is available 48-96 hours after online publication and is updated daily on week days.
Initial download of the metrics may take a while.