Fig. 4
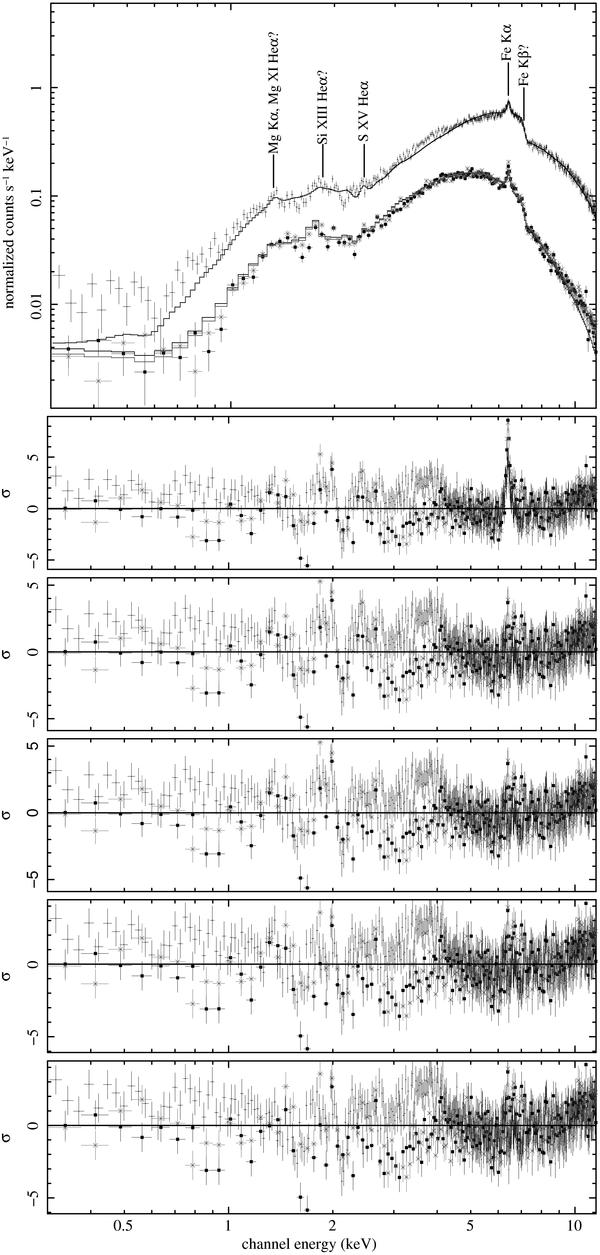
Fluorescence emission lines modelling of the phase-averaged spectra PN & MOS of 4U 1538−52. Top panel: spectra and best-fit model (three absorbed power laws and four emission lines) obtained with EPIC/PN and EPIC/MOS. Bottom panels show the residuals in units of σ for models taking different numbers of emission lines into account (MOS-1 black filled square and MOS-2 grey cross). Second panel: without emission lines. Third panel: fluorescence iron emission line at ~6.4 keV. Fourth panel: fluorescence iron emission line plus a recombination line at ~2.42 keV. Fifth panel: fluorescence iron emission line plus two recombination lines at ~2.42 keV and ~1.90 keV. Bottom panel: fluorescence iron emission line plus three recombination lines at ~2.42 keV, ~1.90 keV and ~1.34 keV.

Current usage metrics show cumulative count of Article Views (full-text article views including HTML views, PDF and ePub downloads, according to the available data) and Abstracts Views on Vision4Press platform.
Data correspond to usage on the plateform after 2015. The current usage metrics is available 48-96 hours after online publication and is updated daily on week days.
Initial download of the metrics may take a while.