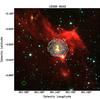
Fig. 5
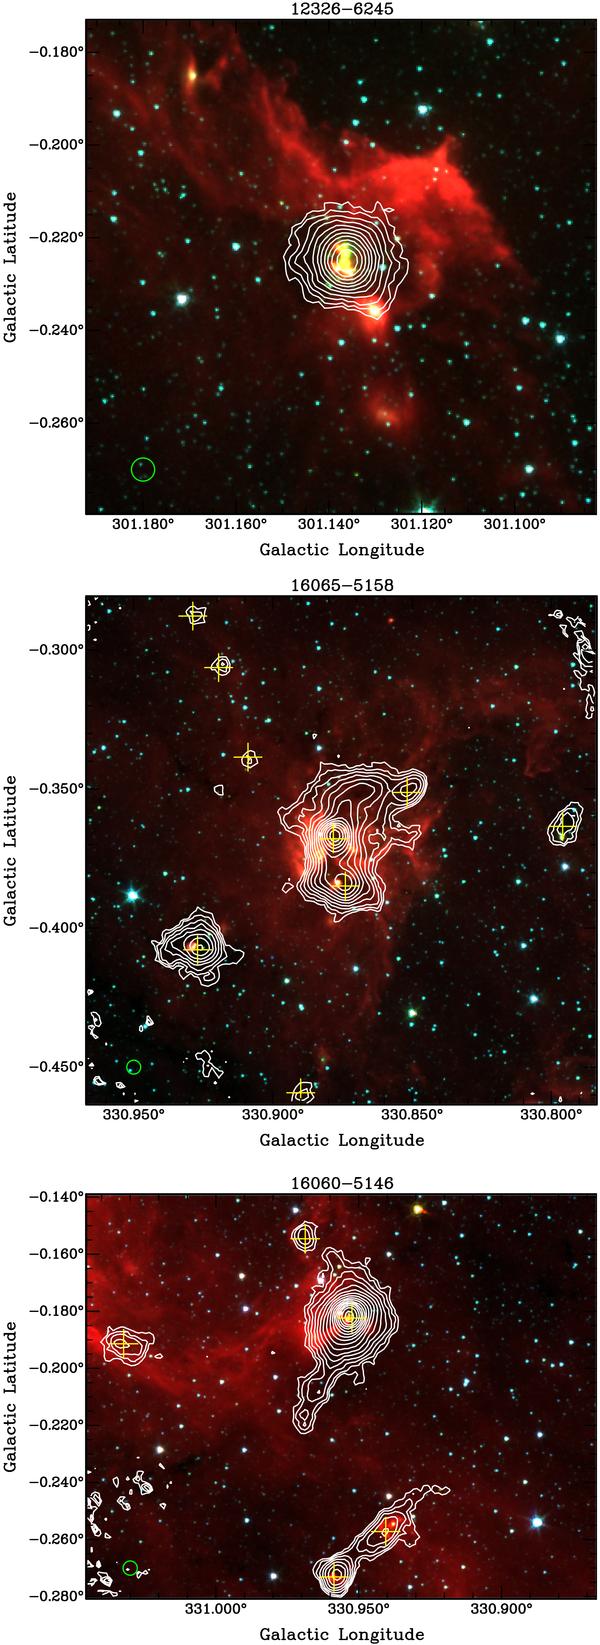
LABOCA 870 μm emission (shown as contours), starting from 5σ and continuing in multiples of 1.4σ (see Table 14). The yellow crosses mark the sub-cores in 16060−5146 and 16065−5158. The LABOCA beam is shown as green circle in the lower left of the image. The three-color image shows 3.6 (blue), 4.5 (green) and 8 μm (red) emission from the Spitzer GLIMPSE survey.
Current usage metrics show cumulative count of Article Views (full-text article views including HTML views, PDF and ePub downloads, according to the available data) and Abstracts Views on Vision4Press platform.
Data correspond to usage on the plateform after 2015. The current usage metrics is available 48-96 hours after online publication and is updated daily on week days.
Initial download of the metrics may take a while.