Fig. 4
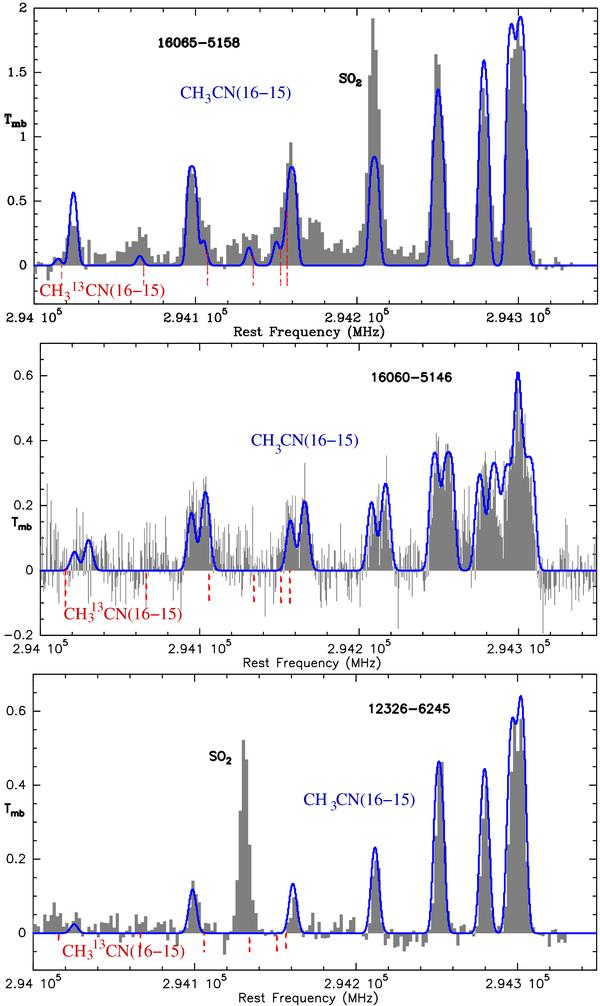
CH3CN(16−15) data at 294 GHz. We show in blue the synthetic model spectrum (see Tables 29, 30). Note that the spectra for the three sources have been observed with different frequency setups, therefore the SO2 line from the image sidebands appears at different frequencies. The rest frequencies of the  lines are marked in red.


Current usage metrics show cumulative count of Article Views (full-text article views including HTML views, PDF and ePub downloads, according to the available data) and Abstracts Views on Vision4Press platform.
Data correspond to usage on the plateform after 2015. The current usage metrics is available 48-96 hours after online publication and is updated daily on week days.
Initial download of the metrics may take a while.