Fig. 3
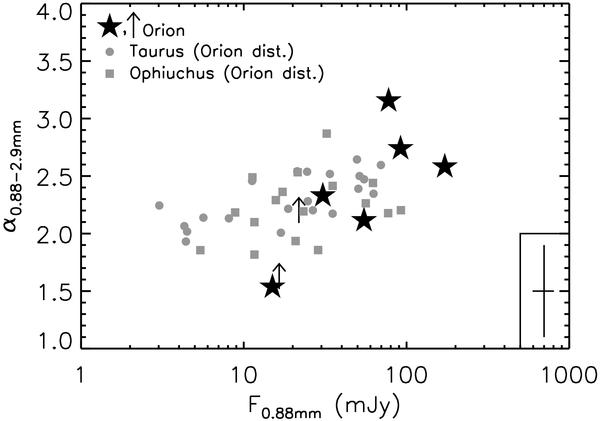
Spectral index between 0.88 and 2.9 mm plotted against the flux at 0.88 mm. Black stars and lower-limits are for the ONC disks, whereas grey circles and squares are for class II disks in Taurus (Ricci et al. 2010a) and Ophiuchus (Ricci et al. 2010b), respectively. The fluxes of the Taurus and Ophiuchus disks have been scaled to the ONC-distance adopted in this work (400 pc) to allow a comparison with the ONC disks. In the lower-right corner of the plot, the typical errorbars of the plotted quantities are shown.
Current usage metrics show cumulative count of Article Views (full-text article views including HTML views, PDF and ePub downloads, according to the available data) and Abstracts Views on Vision4Press platform.
Data correspond to usage on the plateform after 2015. The current usage metrics is available 48-96 hours after online publication and is updated daily on week days.
Initial download of the metrics may take a while.