Fig. 2
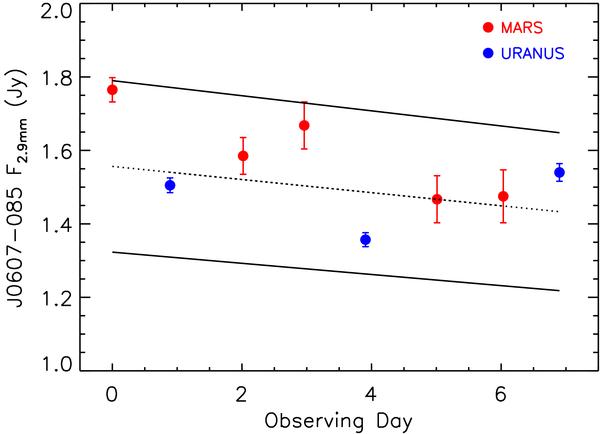
Flux density at 2.9 mm versus observing day for the QSO J0609-085 used as the phase and amplitude calibrator during the CARMA observations. Red circles represent fluxes obtained using Mars as the flux calibrator, whereas blue circles have been obtained using Uranus. The dotted line represents a linear fit of the data, and the two continuous lines refer to the ± 15%-levels from the linear fit.
Current usage metrics show cumulative count of Article Views (full-text article views including HTML views, PDF and ePub downloads, according to the available data) and Abstracts Views on Vision4Press platform.
Data correspond to usage on the plateform after 2015. The current usage metrics is available 48-96 hours after online publication and is updated daily on week days.
Initial download of the metrics may take a while.