Fig. 4
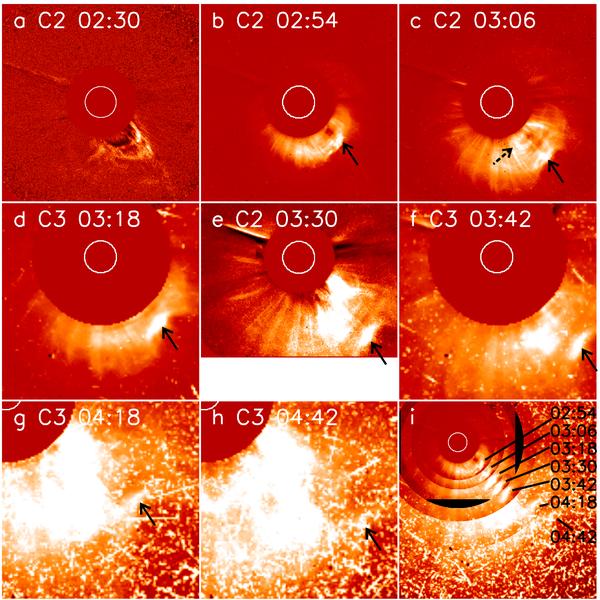
CME base-difference images from SOHO/LASCO at different moments. A pre-event image at 02:06 UT has been subtracted in each case. The solid arrows denote a brightness increase at the CME front. The CME bright core (dashed arrow) appeared at 03:06 UT in panel c). Panels a)–h) have the same size of windows. Panel i) combined the CME difference images from 02:54 to 04:42 UT, during which a bright increase at the CME front can be traced (see the solid lines). The white circle denotes the Sun.
Current usage metrics show cumulative count of Article Views (full-text article views including HTML views, PDF and ePub downloads, according to the available data) and Abstracts Views on Vision4Press platform.
Data correspond to usage on the plateform after 2015. The current usage metrics is available 48-96 hours after online publication and is updated daily on week days.
Initial download of the metrics may take a while.