Fig. 3
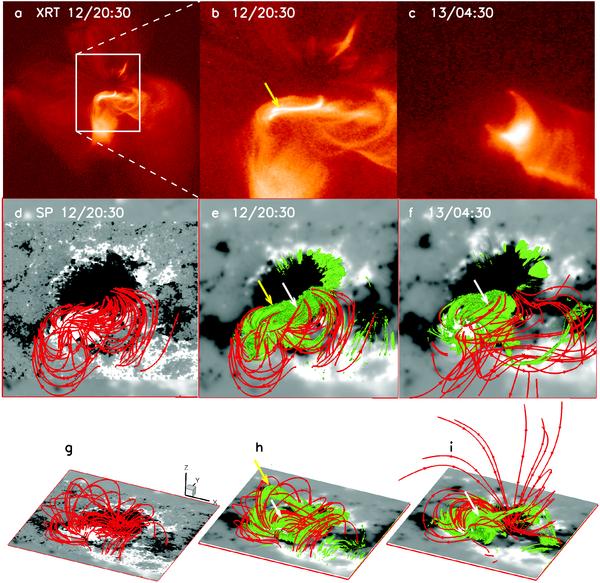
Comparisons between the extrapolation structures and the XRT observations. The first row: the XRT observation at 20:30 on 2006 December 12 before the X3.4 flare (panels a), b)) and at 04:30 UT on 2006 December 13 after the flare (panel c)). The white rectangle in panel a) shows the field of view of the seven other panels. Second row: visualizations of the sample closed field lines (red) and the iso-surface of the current density at the level of 6.96 mA m-2 (green) within the NLFFF model volume (Wheatland 2007) at 20:30 UT on December 12 and at 04:30 UT on December 13, shown against the corresponding map of Hinode/SP Bz at the photosphere (panel d)) and at a height of z = 1371 km (panels e) and f)). The last row shows the 3D images of the middle row. The transverse CS (yellow arrows) and the vertical one (white arrows) can be clearly identified in panel h).
Current usage metrics show cumulative count of Article Views (full-text article views including HTML views, PDF and ePub downloads, according to the available data) and Abstracts Views on Vision4Press platform.
Data correspond to usage on the plateform after 2015. The current usage metrics is available 48-96 hours after online publication and is updated daily on week days.
Initial download of the metrics may take a while.