Fig. 1
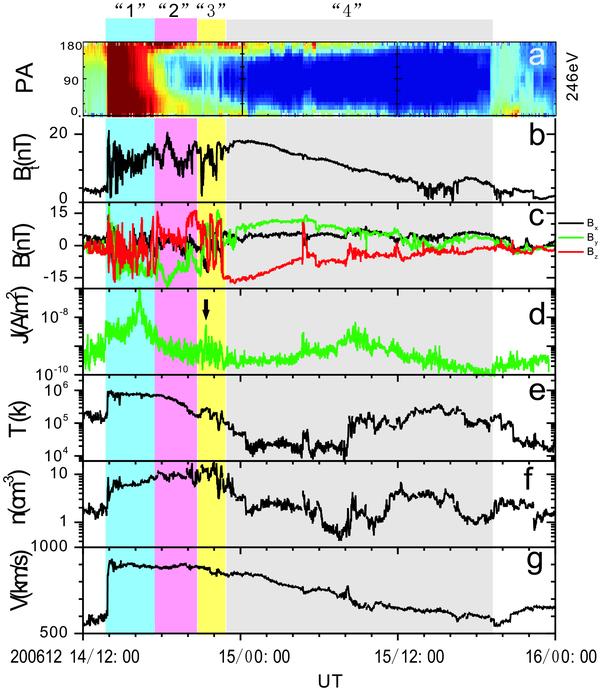
Observations from the ACE and STEREO spacecrafts showing interplanetary structures associated with the event on 2006 December 13. The passage of different structures is indicated by the different colored intervals, i.e., the shock sheath (blue interval “1”), the interplanetary magnetic arcades (pink interval “2”), and the interplanetary CS (yellow interval “3”), as well as the MC (gray interval “4”). Panel a) shows the distribution of electron pitch angles detected by ACE. Panels b) and c) show the magnetic field magnitude and the field components Bx (black line), By (green line), and Bz (red line), in GSM coordinates. The current density calculated from the STEREO A and B magnetic field data is presented in Panel d), in which the current concentrations as denoted by the arrow are believed to originate in the transverse CS during the CME initiation. Panels e) to g) show the corresponding plasma temperature, density, and velocity from ACE observations.
Current usage metrics show cumulative count of Article Views (full-text article views including HTML views, PDF and ePub downloads, according to the available data) and Abstracts Views on Vision4Press platform.
Data correspond to usage on the plateform after 2015. The current usage metrics is available 48-96 hours after online publication and is updated daily on week days.
Initial download of the metrics may take a while.