Fig. 3
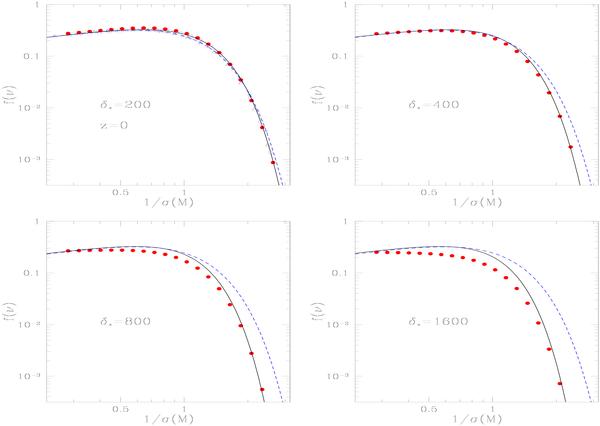
The halo mass functions at redshift z = 0, for halos defined by a nonlinear density contrast δ∗ = 200,400,800, and 1600. The solid line is our model (35), the dashed line is the fit from Sheth & Tormen (1999), which does not change with δ∗, and the points are the results from numerical simulations in Tinker et al. (2008). The value of the parameter α in Eq. (31) is set to α = 2.2. Here M = Mδ∗ is the halo mass enclosed within the radius defined by the density threshold δ∗.
Current usage metrics show cumulative count of Article Views (full-text article views including HTML views, PDF and ePub downloads, according to the available data) and Abstracts Views on Vision4Press platform.
Data correspond to usage on the plateform after 2015. The current usage metrics is available 48-96 hours after online publication and is updated daily on week days.
Initial download of the metrics may take a while.