Fig. 1
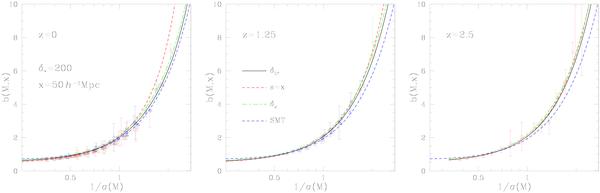
The halo bias b(M,x) as a function of σ(M), at distance x = 50 h-1Mpc, for halos defined by the nonlinear density contrast δ∗ = 200. We plot our results at redshifts z = 0 (left panel), z = 1.25 (middle panel), and z = 2.5 (right panel). The black solid line, “δL ∗ ”, is the theoretical prediction (24), the red dashed line, “s = x”, corresponds to the approximation where halo motions are neglected, and the green dot-dashed line, “δc”, corresponds to the use of δc = 1.686 instead of δL ∗ . The blue dashed line, “SMT”, is the fit from Sheth et al. (2001), and the points are the results from numerical simulations of Tinker et al. (2010).
Current usage metrics show cumulative count of Article Views (full-text article views including HTML views, PDF and ePub downloads, according to the available data) and Abstracts Views on Vision4Press platform.
Data correspond to usage on the plateform after 2015. The current usage metrics is available 48-96 hours after online publication and is updated daily on week days.
Initial download of the metrics may take a while.