| Issue |
A&A
Volume 525, January 2011
|
|
|---|---|---|
| Article Number | A113 | |
| Number of page(s) | 10 | |
| Section | Extragalactic astronomy | |
| DOI | https://doi.org/10.1051/0004-6361/201015608 | |
| Published online | 06 December 2010 | |
The missing gas problem in GRB host galaxies: evidence for a highly ionised component
1
Max-Planck Institut für Extraterrestrische Physik,
Giessenbachstrasse,
85748
Garching,
Germany
e-mail: This email address is being protected from spambots. You need JavaScript enabled to view it.
2
Universe Cluster, Technische Universität München,
Boltzmannstrasse 2,
85748
Garching,
Germany
Received:
18
August
2010
Accepted:
30
September
2010
Abstract
There is considerable discrepancy between the amount of X-ray absorption and what is inferred from optical (rest frame UV) as measured along gamma-ray burst (GRB) sight lines, with the former typically an order of magnitude higher than what would be expected from the measurement of neutral element species via optical absorption line spectroscopy. We explored this “missing gas problem” in a sample of 29 GRBs with redshifts in the range 0.7–6.3 by studying the X-ray and optical spectra, as well as the afterglow broadband spectral energy distributions. The low ionisation species detected in the UV are associated with the neutral interstellar medium in the GRB host galaxy, while soft X-ray absorption, which is weakly dependent on the ionisation state of the gas, provides a probe of the total column of gas along the sight line. After careful consideration of any systematic effects, we find that the neutral gas consists of ≲ 10% of the total gas, and this limit decreases the more ionised the X-ray absorbing gas is, which in our spectral fits is assumed to be neutral. Only a very small fraction of this ionised gas, however, is detected in UV absorption lines with ionisation potentials up to ~200 eV (i.e. Si iv, C iv, N v, O vi), which leaves us to postulate that the X-ray excess comes from ultra-highly-ionised, dense gas in the GRB vicinity.
Key words: gamma rays: ISM / galaxies: irregular / ISM: abundances / ultraviolet: ISM / gamma rays: galaxies
© ESO, 2010
1. Introduction
The vast luminosities emitted by quasi stellar objects (QSOs) have long been recognised as providing a powerful tool with which to study the environmental properties of high-redshift galaxies, and ever since the discovery of gamma-ray burst (GRB) afterglows (GRB 970228, van Paradijs et al. 1997), GRBs have also been increasingly used to probe distant, otherwise inaccessible environments through their highly luminous emission (e.g. Kawai et al. 2006; Berger et al. 2006; Fynbo et al. 2006; Ruiz-Velasco et al. 2007; Greiner et al. 2009). Recent years have seen an increase in the abundance of early-time, broadband photometric and spectroscopic data of GRBs, largely owing to the success of the rapid-response, multi-wavelength GRB mission, Swift (Gehrels et al. 2004), and this has revolutionised our capabilities for studying the GRB afterglow and the properties of its host galaxy in detail. GRB observations are now reaching further distances than QSOs (e.g. GRB 090423, Salvaterra et al. 2009; Tanvir et al. 2009), and their transient nature allows the host galaxy to be studied at later epochs free of the blinding GRB afterglow (e.g. Fruchter et al. 2006; Savaglio et al. 2009).
There is now a well-established connection between long duration GRBs (≳2 s, Kouveliotou et al. 1993), which are the focus of this work, and the formation of massive stars (e.g. GRB980425: Galama et al. 1999; GRB 030329: Hjorth et al. 2003; Stanek et al. 2003). Due to the short lifetimes of massive stars, GRB afterglow observations therefore probe the gas and dust within areas of star formation, in addition to the interstellar medium (ISM) of young, distant galaxies, as well as the intervening intergalactic matter (IGM) along these lines of sight.
From the increasing sample of GRB spectroscopic observations that cover the rest frame Lyα feature at 1215 Å, it is becoming clear that GRB host galaxies have high column densities of cold neutral gas (T ≲ 103 K), with the large fraction of GRB hosts containing a damped-Lyα (DLA) system (log NHI > 20.3 cm-2) or sub-DLA (19.0 < log NHI < 20.3 cm-2). The survival of certain species, such as Mg i, and time varying Fe ii and Ni ii fine-structure lines, place this neutral gas component at a few hundred parsecs from the GRB (e.g. Prochaska et al. 2006; Vreeswijk et al. 2007; Ledoux et al. 2009), within the ISM of the host galaxy.
Absorption by molecular hydrogen in the UV rest frame may provide a probe of the star-forming region closer in to the GRB, where H2 would be expected to exist (Tumlinson et al. 2007). Nevertheless, despite extended efforts (e.g. Vreeswijk et al. 2004; Tumlinson et al. 2007), molecular hydrogen absorption has, as of now, only been clearly detected in the spectrum of GRB 080607 (Prochaska et al. 2009)1, and even then the molecular hydrogen may have originated in another molecular cloud along the line-of-sight distinct from the star-forming region surrounding the GRB. However, the number of GRBs with adequate spectral resolution and coverage to detect the H2 Lyman-Werner absorption lines continues to be small, and H2 absorption lines stemming from the GRB star-forming region may still be detected (Tumlinson et al. 2007).
For high-z GRBs (z ≳ 2.0), the circumburst environment may be probed further by detecting absorption lines produced by highly-ionised species (i.e. ionisation potentials between 50–150 eV) present in the hot gas (T ~ 104 K) surrounding the GRB. Although these highly ionised absorption lines may also originate in hot gas in the halo of the galaxy, measurements of O vi, C iv, Si iv and N v in a handful of GRB afterglow spectra have been used to probe the gas close to the GRB progenitor star (Fox et al. 2008; Prochaska et al. 2008).
In contrast to the specific regions of gas that can be identified from UV spectra, X-ray spectroscopic observations provide measurements of the total column density of gas along the line-of-sight, probing both the cold neutral gas and the warm ionised regions. Soft X-rays with energies <0.8 keV are absorbed by medium-weight metals along the line-of-sight, which is predominantly in the form of oxygen and, to a lesser extent, of carbon and nitrogen. Furthermore, the cross-section of oxygen remains relatively unchanged regardless of ionisation state (Verner & Yakovlev 1995), making it a good proxy for the host galaxy’s total oxygen column density.
In addition to the conditions of the host galaxy gas along the line-of-sight, the host dust abundance and extinction properties can be explored from dust depletion patterns inferred from relative metal abundances (e.g. Savaglio & Fall 2004), and also from the analysis of broadband infrared (IR) through to UV spectral energy distributions (SED) (e.g. Galama & Wijers 2001; Stratta et al. 2004; Kann et al. 2006; Starling et al. 2007; Schady et al. 2007, 2010). Soft X-rays are also extinguished and scattered by dust, although by much smaller amounts such that absorption by medium-weight metals are the dominant source of attenuation (e.g. Weingartner & Draine 2001; Draine 2003).
Owing to the complex structure of the absorbing gas and the uncertainties in the location of the various attenuating gas and dust components, a combined analysis of the UV and the soft X-ray energy bands gives a more comprehensive understanding of the properties of the circum- and interstellar medium of GRB host galaxies. For example, the equivalent neutral hydrogen column densities derived from soft X-ray absorption2, NH,X, are typically an order of magnitude higher than the host galaxy neutral hydrogen column densities measured from damped Ly-α absorption, NHI, which led Watson et al. (2007) to conclude that the former probed a significant column of ionised gas that is transparent to UV photons. Using a larger sample, Campana et al. (2010) later reached a similar conclusion.
In this paper we combine the results from the analysis of optical and X-ray spectra, and also of broadband afterglow SEDs, with the aim of providing deeper insight into the ionisation state and dust properties of the host galaxy medium along the line-of-sight to GRBs. Instead of neutral hydrogen, we use absorption lines of singly-ionised metals to trace the neutral gas within GRB host galaxies that can then be compared directly with the soft X-ray absorption, which primarily measures the oxygen column density (neutral and ionised), NO,X. This removes the need for hydrogen column density and host galaxy metallicity measurements, which are frequently uncertain or unavailable, thus increasing our sample size. The results presented here contribute towards a better understanding not only of the nature of galaxies hosting GRBs, but also of the environmental conditions within high-redshift galaxies as a whole.
In Sect. 2 we provide our sample selection criteria, and we describe our data reduction and analysis in Sect. 3. We present our results and discuss their implications in Sect. 4, and our conclusions are summarised in Sect. 5. All quoted errors throughout the paper are 1-σ. Throughout this paper we use the cosmic abundances from Asplund et al. (2009).
2. Sample
The sample selection is based on the requirement that optical spectroscopic data are available for the GRB afterglow with absorption measurements in at least Zn ii, Si ii, S ii, or Fe ii with which to probe the host galaxy neutral gas. All these low ionisation species have ionisation potentials (IPs) slightly greater than for hydrogen, and all are frequently measured in GRB optical spectra. Our initial sample amounted to 7 pre-Swift and 22 Swift GRBs, of which 27 had X-ray afterglow spectroscopic observations (all Swift GRBs plus five pre-Swift GRBs), and 23 had optical/X-ray SED-fit host galaxy visual extinction measurements, AV, (five pre-Swift and 18 Swift GRBs) available either from the literature or with sufficient UV through to infrared (IR) data for an SED analysis of our own to be possible. Owing to the degeneracy that exists between spectral index and extinction, we only consider AV values derived from broadband optical to X-ray SED modelling. As a consequence of our selection criteria, whereby at least one metal line is detected in the optical spectra, a spectroscopic redshift measurement is available for all GRBs in our sample.
Our requirement for an optical afterglow spectrum introduces a selection effect against dim or highly extinguished GRBs, either from dust in the host galaxy, Galactic dust, or dust within intervening systems. GRB host galaxy ISM properties are independent of the Galactic or foreground dust extinction, and selection effects biased against GRBs with high foreground extinction should, therefore, not affect our overall results. Similarly, selection effects against redshift ranges that have few prominent absorption lines in the observer frame optical bandpass (the “redshift desert”; z ~ 1 − 1.5) are likely independent of the GRB host environmental conditions, and again should not affect our overall findings.
The dominant selection effect that we need to worry about is the bias against GRBs that are highly extinguished within their host galaxy. Recent studies suggest that between 20–30% of GRBs are undetected in the optical wavelength range as a result of dust extinction (e.g. Cenko et al. 2009; Fynbo et al. 2009; Perley et al. 2009; Greiner et al. 2010), and there is some indication that these more extinguished GRBs reside in more massive and evolved galaxies than the hosts to optically bright GRBs. It should, therefore, be kept in mind that the results presented in this paper apply to GRBs with low host galaxy extinction along the line-of-sight (AV ≲ 1.0). In the case of selection effects against dim GRBs, our results will be affected if low-luminosity GRBs belong to a different class of GRB than to their high-luminosity counterparts, as suggested by Liang & Zhang (2006) and Nardini et al. (2006, 2008; although see Oates et al. 2009) so this possibility should be kept in mind. We, therefore, stress that the results presented in this paper may not apply to low-luminosity and/or highly extinguished GRBs.
GRB host galaxy column densities for 29 GRBs.
3. Data analysis and reduction
All column density measurements derived from optical spectroscopy that have been used in this paper are listed in Table 1 and have mostly (~75%) been taken from the literature, in which case the corresponding reference is also given. In a few cases we re-computed the column densities ourselves using the published equivalent widths (EW) and applying standard techniques. For the 27 GRBs with X-ray spectroscopic data, we primarily used the X-ray column densities measured from optical to X-ray SED analysis for consistency with the AV vaue that we used. Where this was not possible because of the lack of optical/NIR data (five GRBs), we used X-ray absorption values measured from the X-ray data alone, which we took from Evans et al. (2009).
Both in our own X-ray analysis and for the results taken from the literature, the X-ray fitting package xspec (Arnaud 1996) was used to model the X-ray spectra with an absorbed power-law (phabs*pow), where solar abundances were assumed. This provided an equivalent neutral hydrogen column density, NH,X, which we converted back into an oxygen column density, NO,X. We also list this in Table 1 with corresponding references where relevant3. We note that in using the photoelectric absorption model phabs, we assume that the soft X-ray absorbing gas is neutral, which may not be an accurate approximation (e.g. Watson et al. 2007; Prochaska et al. 2008), and which would thus cause the column of absorbing material would be underestimated. The best-fit NH,X, hence also NO,X listed in Table 1, are thus effective lower limits. Furthermore, for increasing redshift, the absorption from oxygen is increasingly shifted out of the bandpass such that at z > 2.5 the majority of the soft X-ray absorption is caused by other heavier elements. In this case our oxygen column density measurements are indirectly determined by assuming solar relative metal abundances, which is an assumption typically made in X-ray spectroscopic analysis. However, the implications of such an assumption apply as much to NH,X as to NO,X, but in the latter case a lot of the uncertainty corresponding to the metallicity of the environment for the large fraction of GRBs at z < 2.5 is removed.
In the final column of Table 1 we give the best-fit host galaxy visual extinction along the line-of-sight to the GRB, AV, with relevant references provided when taken from the literature. Finally, the GRB redshift, along with Galactic soft X-ray absorption and visual extinction taken from Kalberla et al. (2005) and Schlegel et al. (1998) is also given in Table 1.
3.1. SED analysis
For consistency within our sample, we require that the host galaxy visual extinction and soft X-ray absorption are measured in the same way for each GRB. In Schady et al. (2010), Greiner et al. (2010), and Starling et al. (2007), host extinction and absorption values were measured from the same model fits to the GRB SEDs, which we describe in the next section. We, therefore, consider the results from these papers to be comparable to each other. For six GRBs in our sample not analysed in any of the papers listed above, sufficient optical/NIR and X-ray data were available to produce a broadband SED. In these cases we therefore performed our own SED analysis following the method described in Schady et al. (2010).
GRB 020405 and GRB 030226 had available Chandra data, which we reduced with the standard procedure. The optical data for these SEDs was taken from the literature (GRB 020405; Masetti et al. 2003, GRB 030226; Klose et al. 2004). The remaining four GRBs (GRB 050401, GRB 090323, GRB 090328, GRB090926A) had Swift XRT (Burrows et al. 2005a) and UVOT (Roming et al. 2005) data, which were taken from the UK Swift data archive4, as well as g′r′i′z′ and JHK data taken with GROND, a simultaneous 7-channel imager (Greiner et al. 2008) mounted at the 2.2 m MPI/ESO telescope at La Silla (Chile). All XRT data were in photon counting (PC) mode and were reduced with the xrtpipeline tool (v0.12.4). Spectra were extracted following the method described in Evans et al. (2009), avoiding time intervals that showed evidence of spectral evolution, such as during the early-time steep decay phase of the X-ray light curve (Nousek et al. 2006), during flares (Falcone et al. 2007). Both UVOT and GROND data were reduced following the standard procedures described in Poole et al. (2008) and Küpcü-Yoldaş et al. (2008), respectively.
The SEDs were fitted within xspec (v12.6.0) with a Galactic and host-absorbed and extinguished power law, allowing for a cooling break between the X-ray and optical energy bands (with change in spectral slope fixed to Δβ = 0.5; Sari et al. 1998) when it provided a significantly improved fit. Neutral hydrogen absorption from the IGM was also taken into account in our model using the prescription from Madau (1995). Solar abundances are assumed in the soft X-ray absorption measurements, and the host visual extinction was measured from the best-fit to the data between the Small or Large Magellanic Cloud (SMC and LMC, respectively), or the Milky Way mean extinction laws (Pei 1992).
3.2. Optical spectroscopy analysis
For the ~25% of the sample where we performed our own optical spectroscopic analysis, column densities of metals were derived by the curve of growth (COG) analysis (Spitzer 1978) or, if appropriate, by the apparent optical depth (AOD) (Savage & Sembach 1991) method. The COG provides reliable results through the linear approximation when the equivalent width of a line is EW < 0.1 Å and the effective Doppler parameter is b > 20 km s-1. For stronger lines, the COG requires the detection of at least several lines with different oscillator strengths of the same ion. We, therefore, used the AOD method for moderate-to-low EWs, provided that the effective Doppler parameter not very low (b ≳ 10 km s-1, Prochaska et al. 2007a).
4. Results and discussion
4.1. Dust within the GRB host galaxy
Iron is a highly refractory element, and its relative abundance with non-refractory, iron-peak elements acts as a good tracer of the abundance of dust particles present within the region of absorbing gas. The column density of singly ionised iron and zinc are often used for this purpose since both are frequently measured in UV spectra and both trace neutral gas. It has been suggested that a relative zinc-to-iron abundance of up to [Fe/Zn]5 ≈ − 0.3 dex could arise in low-metallicity environments due to differences in the nucleosynthesis processes from solar (Prochaska & Wolfe 2002). However, any zinc-to-iron relative abundances lower than this are likely to indicate dust depletion.
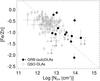 |
Fig. 1 Iron-to-zinc relative abundance, [Fe/Zn], as a function of the logarithmic Zn ii column density. GRB host galaxy measurements are plotted as solid circles, and a sample of QSOs taken from Savaglio (2006) (open circles) are plotted for comparison. The dashed line shows the ordinary least-squares (OLS) bisector fit to the combined GRB and QSO data, which has a power-law index of − 0.7. GRBs with limits on either Fe ii of Zn ii are plotted in grey with smaller symbols, as well as with up- and leftward pointing arrows, respectively. |
In Fig. 1 we plot the iron-to-zinc relative abundance [Fe/Zn] as a function of the Zn column density, NZnII, for 18 GRBs in our sample with Fe ii and Zn ii column density measurements, where at least one is well constrained (i.e. not an upper or lower limit). Of these 18 GRBs, five only have an upper limit on the Zn ii column density. A sample of QSOs taken from Savaglio (2006) are also plotted for comparison, with the line of best-fit to the combined GRB and QSO sample. Given the increasing evidence that the bulk of neutral gas within GRB host galaxies probed by optical afterglow spectra lies at a few hundred parsecs from the GRB, the similarity in the trend toward smaller iron-to-zinc relative abundances for higher Zn ii column densities between QSOs and GRBs is not so surprising. A Spearman rank test for the 13 GRBs with well-measured Fe ii and Zn ii column density measurements gives a Spearman coefficient of ρ = − 0.51 at 90% confidence, and the Spearman rank coefficient remains the same when we include the QSO data, although the confidence in the coefficient increases, indicating a significant anti-correlation between [Fe/Zn] and NZnII, and thus suggesting that dust depletion tends to be higher for higher Zn ii column densities.
For all 13 GRBs that have well-constrained iron and zinc column densities, seven also have measurements of the host galaxy visual extinction, AV, at the 3σ level (see Table 1). To test whether the correlation between dust depletion and Zn ii column density indicated by Fig. 1 agrees with the best-fit AV values from our SED analysis, we split this subsample of seven GRBs into two, depending on their Zn ii column density. We used a threshold of NZnII = 13.5, which is the mean Zn ii column density for the GRB subsample, and find that for the set with log NZnII < 13.5 and log NZnII > 13.5, the mean best-fit AV values are ⟨ AV ⟩ = 0.17 and ⟨ AV ⟩ = 0.62, respectively, with respective standard deviations of 0.07 and 0.27. Although the scatter in AV is large, it is reassuring that the trend toward larger dust-depletion for higher Zn ii column densities observed in our optical spectroscopic analysis is similarly present in our SED analysis results.
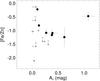 |
Fig. 2 Iron-to-zinc relative abundance, [Fe/Zn], against visual extinction, AV, for a sample of 16 GRBs. GRBs with limits on either [Fe/Zn] or AV are plotted in grey with smaller symbols. |
This general agreement is illustrated better in Fig. 2, where we have plotted the relative iron-to-zinc abundance, [Fe/Zn], against visual extinction, AV, for 16 of the GRBs included in Fig. 1 that have available AV measurements. GRBs with lower limits in either [Fe/Zn] or AV are plotted with smaller symbols, and GRBs with SEDs best-fit with a spectral break between the optical and X-ray energy bands are plotted as open circles. There is one clear outlier in this GRB sample with a high visual extinction of AV > 1.0 but small [Fe/Zn]. This data point corresponds to GRB 070802, and an abundance of dust along its line-of-sight, as suggested by its large afterglow extinction, may thus no longer make our assumption of negligible zinc depletion valid. Further evidence that the line-of-sight to this GRB has significant amounts of dust is in the clear detection of a 2175 Å dust extinction feature in its optical spectrum (Krühler et al. 2008; Elíasdóttir et al. 2009)6, which is thought to be more prominent in dusty environments (e.g. Noll et al. 2007; Prochaska et al. 2009). Although the fraction of zinc in grains is generally negligible along numerous lines-of-sight, it can be as high as 20% in the cool-disc ISM (Savage & Sembach 1996), where the dust abundance is higher. The inconsistencies between [Fe/Zn] and AV for GRB 070802 may therefore be due to a significant amount of both Fe and Zn dust depletion, causing the relative iron-to-zinc metal abundance to only be a little lower than solar abundances.
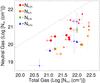 |
Fig. 3 Host-galaxy neutral gas column density, Nntr, against host-galaxy total gas column density, NN,O, along the line-of-sight to a sample of 26 GRBs. For each GRB, Nntr is derived from either the column density of Zn ii (red circles), S ii (orange squares), Si ii (green stars), or Fe ii (blue triangles), where a correction for dust depletion is applied to NN,Si and NN,Fe. Smaller data points correspond to those taken from low- or mid-resolution spectra, and larger data points are taken from high-resolution spectra (R > 10 000). The dashed line corresponds to where Nntr is equal to NN,O. |
4.2. Gas ionisation state
4.2.1. Total vs. neutral gas
To trace the neutral gas within a GRB host galaxy, we preferred to use the ion Zn ii or S ii, but if absorption measurements of neither of these two ions were available, then we used Si ii or otherwise Fe ii. This is due to the inherent uncertainties present in the dust depletion of the refractory elements Si ii, and especially Fe ii. When column densities for both Zn ii and S ii are available, the one with the smaller error bars is used. When only Si ii or Fe ii absorption measurements were available, a dust correction was applied to the measured column density. The broad agreement shown in the previous subsection between the dust depletion (inferred from the iron-to-zinc relative abundances), and the best-fit visual extinction (inferred from the SED), improves our confidence in the assumption that zinc dust depletion is typically negligible. We would expect to see a discrepancy between [Fe/Zn] and AV where this assumption no longer applies (see Fig. 2). To correct for the dust depletion of iron and silicon, we therefore fitted a linear function to log NSiII and log NFeII against log NZnII, respectively, for the combined data set of GRBs and QSOs, and used these lines of best-fit to correct for dust depletion in our NSiII and NFeII measurements. We then corrected for cosmic abundance variances by normalising all our measurements to each other using the abundances from Asplund et al. (2009). We denote the normalised column densities of oxygen, zinc, silicon, sulphur and iron by NN,O, NN,Zn, NN,Si, NN,S and NN,Fe, respectively.
In Fig. 3 we plot the neutral gas column density, Nntr, represented by either NN,Zn, NN,S, NN,Si, or NN,Fe, against NN,O, which represents the total column of gas (neutral and partially ionised), where both NN,Si and NN,Fe have been corrected for dust depletion. We also differentiate between the resolution of the optical spectra used for each GRB observation, where those measurements taken from high-resolution spectra (R > 10 000) are plotted with larger symbols, and measurements from low- or mid-resolution spectra have smaller ones. Just under two thirds of our sample have low- or mid-resolution spectral data, and this may have consequences for the precision of the column density measurements in these cases, which we discuss below. The line in Fig. 3 corresponds to where the column density of neutral gas is equal to the total column density of gas as probed by our X-ray absorption measurements. From this figure it is clear that for all GRBs, NN,O is larger than the column density of neutral gas, Nntr, by typically around an order of magnitude.
4.2.2. Systematic effects
The neutral gas column density in two thirds of the GRBs plotted in Fig. 3 was measured from Fe ii and Zn ii absorption, and in these cases at least some of the excess absorption measured in X-rays could be due to GRB hosts having α-element overabundances. α-elements are produced within the sequence of He, such as O, Mg, Si and S, and trace massive star formation. An overabundance of α-elements should, therefore, be expected in young, star-forming galaxies such as GRB hosts (e.g. Prochaska et al. 2007b). However, such overabundances would not account for the order-of-magnitude differences between X-ray and optical absorption measurements, nor would it apply to the third of the sample with neutral gas column densities traced by Si ii absorption. We, therefore, do not consider an abundance in α-elements within GRB host galaxies to be the dominant cause of the higher values of NN,O measurements compared to Nntr.
Alternatively, saturation and lack of resolution in the optical spectral data could lead to the metal column densities being underestimated (e.g. Prochaska 2006). However, this is not a problem when high-resolution spectra are available, which is the case for ~40% of our sample. Optical column density measurements for this fraction of the sample are plotted with larger symbols in Fig. 3, and most of these fall well below the dashed line, in the region of space where the total gas column density is significantly higher than the neutral gas column density. For the remaining ~60% of the sample, the error on the neutral gas column density measured from low- and mid-resolution optical spectra may be as much as 0.6 dex, although this would be a highly pessimistic case. However, even in this unlikely situation, over half of the mid- and low-resolution data points would still have a total gas column density at least an order of magnitude higher than the neutral gas column density. We therefore conclude that although the resolution of the optical spectroscopic data available may cause the neutral gas column density to be underpredicted, for the majority of the data points in Fig. 3, the neutral gas column density would remain significantly smaller than the metal column density implied by the X-ray data.
A clear possibility that we need to address is that of unaccounted intervening absorbing systems in our line-of-sight, which would result in the GRB host soft X-ray absorption being overestimated. In optical spectroscopy the locations of any intervening absorption systems are clearly determined, and thus the absorption from such systems is easily separated from absorption within the GRB host galaxy. However, the resolution of our X-ray spectra is insufficient for the contribution from several absorbing systems on the GRB afterglow soft X-ray absorption to be disentangled. It should be said that such strong intervening absorbing systems are rare, and the probability that there is an absorption system in the line-of-sight to a GRB of sufficient optical depth to contribute a measurable amount of soft X-ray absorption is, therefore, low (O’Flaherty & Jakobsen 1997; Campana et al. 2006). In Watson et al. (2007) this issue was looked at in greater detail, and they estimate that the absorption resulting from any intervening system would need to be two orders of magnitude more than the absorption measured thus far in optical spectra; specifically more than the absorption measured from Mg ii systems, which are typically the largest of absorbers. Further to this, Watson et al. (2007) noted the soft X-ray absorption in the line-of-sight to blazars to be small relative to that of GRBs. This is despite the two types of sources having comparable numbers of intervening Mg ii absorption systems along the line-of-sight, thus further supporting an intrinsic absorption interpretation.
A greater worry in our X-ray measurements is that of the Galactic absorption, which in the case of our GRB sample can be uncertain by up to 15% (Kalberla et al. 2005). Any underestimate of the Galactic soft X-ray absorption would result in the host galaxy soft X-ray absorption being overestimated by a factor of (1 + z)2.6 (Galama & Wijers 2001). To investigate whether such a factor could account for the high values of NN,O observed in Fig. 3, we re-determined the host galaxy X-ray absorption for each GRB plotted in the figure, but this time setting the Galactic absorption along the line-of-sight to its 3σ upper limit. We found the re-calculated host galaxy X-ray absorption values to have typically decreased by a little less than 50%, thus remaining a factor of five or so greater than Nntr. Any uncertainties in our Galactic absorption corrections therefore have no significant impact on our primary result that NN,O is a factor of several larger than Nntr.
We therefore conclude that the offset between NN,O and Nntr within GRB host galaxies is predominantly due to X-ray absorption measurements probing a larger column of gas than the UV low ion absorption line measurements. This larger column of gas must be ionised, which is not traced by the low ionisation species that we have analysed, but which does absorb photons in the soft X-ray energy bands. Dust extinction of soft X-rays may also contribute to the large X-ray inferred column densities. However, because of self-shielding, the fraction of soft X-ray photons lost to extinction will be significantly below the fraction absorbed by oxygen, carbon, and nitrogen (e.g. Draine 2003). Furthermore, given that the soft X-ray absorption column densities were measured from a neutral absorption model fitted to the X-ray spectra, an ionised gas absorption component would turn the X-ray column density measurements into lower limits, as already indicated in Sect. 3. The order-of-magnitude difference between the column density of neutral gas and the total gas column density measured from the X-ray data would thus suggest that, at least along the line-of-sight to the GRB, ~90% of the gas within GRB host galaxies is ionised.
In at least some GRBs, most of the neutral gas lies at a few hundred parsecs from the GRB (e.g. Prochaska et al. 2006; Vreeswijk et al. 2007), suggesting that little neutral gas remains within the star-forming region in which the GRB is likely to be embedded. It may therefore not be so surprising that the ratio between ionised-to-neutral gas is so high. As an illustrative example, if we assume a GRB to lie within a dense star-forming region of radius 20 pc, then a hydrogen density ρ ≈ 50 cm-3 within this region would be needed to account for our soft X-ray observations, which is not unreasonable. Such a scenario provides a simple explanation for the higher column densities of soft X-ray absorbing gas compared to the neutral gas column densities. It is also consistent with the association of long GRBs with massive star formation, whereby GRBs are expected to lie within dense star-forming regions of the host galaxy, as well as being compatible with the neutral gas lying several hundred parsecs from the GRB, as indicated by optical spectroscopy of some GRB afterglows.
In both Watson et al. (2007) and Prochaska et al. (2008) the quoted distances from the GRB out to which gas could be ionised were less than the radius of 20 pc that we consider above (3 pc and 10 pc, respectively). However, these shorter distances were based on the assumption that the GRB was the sole source of ionising photons. When considering the contribution from other massive stars in the neighbourhood, the radius of the ionisation front could increase out to >30 pc from the GRB (Prochaska et al. 2008; although Watson et al. 2007, argue there is only a small increase in size of the ionised region). Nevertheless, even when the size of the ionised region is within 3–10 pc of the GRB, a particle density of ρ ≈ 100 − 250 cm-3, which remains within reason, would similarly satisfy our observations.
4.2.3. Highly ionised gas
To investigate this scenario further, we take a look at the column densities of metals in a higher ionisation state than has been looked at so far. Whereas low ion elements will only exist far from the GRB, such as Zn ii, Si ii, and Fe ii, more highly ionised metals, such as C iv, Si iv, N v, and O vi could survive within the circumburst environment of the GRB (Fox et al. 2008; Prochaska et al. 2008), and may thus make up a large fraction of the ionised gas probed by our soft X-ray observations. Both Fox et al. (2008) and Prochaska et al. (2008) used the measurements of highly ionised metals to probe the environmental conditions close to the GRB for a combined sample of nine GRBs, where the former used the column densities of C iv, Si iv, N v, and O vi to trace the highly ionised gas, and Prochaska et al. (2008) focused on measurements of N v, which are typically less saturated.
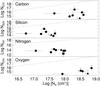 |
Fig. 4 Logarithmic host galaxy column density of the highly ionised atoms C iv, Si iv, N v, and O vi against the total logarithmic column densities of C, Si, N, and O in the top, second, third, and bottom panels, respectively. The total column densities are derived from X-ray observations, denoted by NX. The C iv, Si iv, N v, and O vi measurements plotted as circles are all taken from Fox et al. (2008), the N v data plotted as squares are from Prochaska et al. (2008), and data taken from D’Elia et al. (2010) are plotted as triangles. In all four panels, the dashed line corresponds to where the normalised soft X-ray column density is equal to the column density of the corresponding highly ionised atom. |
To quantify the fraction of gas probed by the soft X-ray energy bands that could be in a highly ionised state we studied further the sample of eight GRBs from Fox et al. (2008) and Prochaska et al. (2008) that had soft X-ray absorption measurements, as well as GRB 090926A, which had high-ion column densities measurements reported D’Elia et al. (2010). This sample allows us to compare the soft X-ray column densities to the highly ionised column densities of N, C, Si, and O. To do this we normalised the soft X-ray absorption measurements to the cosmic abundance of the element in question being compared (i.e. either Si, C, N, or O). Our results are shown in Fig. 4, which compares the logarithmic column density of the highly ionised atoms NCIV, NSIV, NNV, and NOVI to the soft X-ray absorption column densities normalised to C, Si, N, and O cosmic abundances in the top, second, third, and bottom panels, respectively. The normalised soft X-ray absorption column density is denoted by NX to indicate the column density of C, Si, N, or O as determined from our soft X-ray absorption measurements.
It is clear from this figure that all data points lie several orders of magnitude below the dashed lines, indicating that the highly ionised gas within GRB hosts only makes up a small fraction (<0.01%) of the soft X-ray absorption. Figure 3, on the other hand, indicates that ~90% of the gas probed by the soft X-rays is ionised. If the large fraction of this gas is in a lower ionised state, then there should be a signature of this in the detection of strong absorption lines from intermediate ionisation lines with IPs between ~20 eV and ~50 eV (i.e. Si ii and Si iv). This is, however, not the case. For example, Al iii, which has an IP of 28 eV, is frequently observed to be weaker than Al ii, which has an IP of 19 eV. This would, therefore, suggest that most of the ionised gas probed by the soft X-rays is in a ultra-ionised state, with IPs larger than ~200 eV. The signature left by such an ultra-ionised gas would lie predominantly in the soft X-ray energy range, which is already heavily absorbed by oxygen and carbon (both neutral and ionised). Resolving the absorption from an ultra-ionised gas is, therefore, beyond the spectral capabilities of current fast-response X-ray telescopes and will require a future era of X-ray telescopes such as Xenia (Piro et al. 2010).
Another possibility for detecting this ultra-ionised gas would be in the form of variability in emission lines as the gas cools over years (e.g. Perna et al. 2000). To date, analysis investigating such cooling has only been done in the case of GRB 990712 (Küpcü Yoldaş et al. 2006) where five epochs of observations of the host galaxy taken up to 6 years after the burst were used to search for variations in the emission line fluxes. No evidence of variability was found, from which the authors were able to put a limit on the density of the emitting (or ionised) region of n ≲ 6 × 103 cm-3. This remains consistent with our analysis.
4.2.4. Gas ionisation profile
A number of theoretical studies investigating the effect of a GRB on its surrounding environment show the intense radiation field produced by a GRB to be capable of destroying dust out to ~10 pc and ionising gas out to tens of parsecs (e.g. Fruchter et al. 2001; Perna & Lazzati 2002). The large fraction of ionised gas along the line-of-sight to GRBs derived from our optical and X-ray absorption analysis may therefore not be that surprising. What may be of more surprise is the ionisation profile of the gas, which our analysis suggests has a well-detected neutral component, a significantly smaller highly ionised component with IPs reaching up to ~140 eV, and then possibly a very large ultra-ionised component at IPs of >200 eV.
As an illustrative example we used the element nitrogen to better visualise the ionisation profile of the gas within GRB host galaxies along the line-of-sight, which is shown in Fig. 5. Nitrogen is detected in a highly ionised form in six GRBs in our sample, and the neutral (Nntr) and ultra-ionised (Nultrion) fraction of nitrogen are derived from the column densities of neutral gas as traced by S ii or Zn ii, and from the gas column density inferred by soft X-ray absorption measurements, respectively. These column densities are then normalised to the cosmic abundances of nitrogren. An upper limit on the ultra-ionised gas column density, Nultrion, in Fig. 5 (top curve) is represented by a downwards pointing triangle.
The ionisation profile shown in Fig. 5 may arise from a distribution of gas with a density profile approximating a step function, such that the density of the gas is significantly higher close to the GRB than far from the explosion sight, as suggested in Sect. 4.2.2. Perna & Lazzati (2002) showed that a GRB can easily photoionise a dense column of gas (>103 cm-3) out to a few parsecs. However, at lower densities further away from the GRB, the ionising cross-section of the gas drops, leaving the large fraction of the gas at these distances neutral. The ionisation potential bins used in Fig. 5 are, however, crude; especially in the case of gas with IP >200 eV (i.e. Nultion), finer binning could produce a less pronounced dip in the ionisation profile at 20–50 eV (NV) with an extended tail beyond 200 eV. In the context of the step-function-like density profile described above, a more extended, shallower density profile would be produced by a smoother density profile.
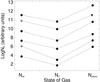 |
Fig. 5 Ionisation profile of gas within the host galaxy of six GRBs as traced by nitrogen. Ionisation state of the gas is divided into three broad components; neutral (Nntr), highly ionised (NV), and ultra-ionised (Nultrion). Highly ionised nitrogen, N v, is measured directly from optical spectra, whereas the column density of neutral nitrogen is determined from either S ii (black circles) or Zn ii (grey circles), and the ultra-ionised column density of nitrogen gas is determined from X-ray measurements. The downward pointing triangle represents an upper-limit. |
A more detailed investigation into the environmental conditions required to produce the observed ionisation profiles shown in Fig. 5 would require detailed modelling of the environment and radiation field produced by the GRB. Our ability to carry out such analysis at this time is, however, limited by the current lack of understanding of the conditions of the gas close to the GRB. Most of the lines measured in optical spectra trace material far from the GRB site, leaving us with little insight into the ionising flux of the radiation field, the structure, and density of the environment, nor its temperature and metallicity. Greater constraint on the environmental properties within a few tens of parsecs to the GRB is, therefore, needed before an attempt to model the ionisation profile along the line-of-sight to the GRB can be made.
5. Summary and conclusions
Using optical and X-ray spectra with optical photometric afterglow data, we have combined the results from both spectroscopic and broadband SED analysis for a sample of 29 GRBs. This allowed us to probe the properties of the host galaxy interstellar medium much deeper than would be possible with the analysis of optical or X-ray data alone.
From a sample of 18 GRBs we confirm the decreasing trend in the iron-to-zinc relative abundance as a function of log NZnII previously observed (e.g. Savaglio 2006), and further find this correlation to be supported by independent dust-extinction measurements from GRB afterglow SEDs.
In comparing UV absorption by singly ionised metals, which trace neutral gas, to the soft X-ray absorption in the afterglows of 26 GRBs, which is representative of the total gas along the line-of-sight, we found the latter to be significantly greater. After taking careful consideration of systematic effects, we found the most likely interpretation for these observations to be that ~90% of the host galaxy gas along the line-of-sight to the GRB is ionised.
Evidence of significant column densities of ionised gas within GRB host galaxies has already been presented, such as in Prochaska et al. (2008) and Fox et al. (2008). In both these papers, the velocity profiles of strong N v absorption in the host galaxies of a handful of GRBs are found to be consistent with arising from highly ionised circumburst gas photoionised by the GRB. However, from our analysis we found that only a negligible fraction (~0.01%) of the X-ray absorbing gas is traced by the highly ionised metals measured in Prochaska et al. (2008) and Fox et al. (2008). This leads us to postulate that the majority of the ionised gas probed by our soft X-ray measurements is in an ultra-ionised state.
Prochaska et al. (2008) estimated that a cold gas (T ≈ 104 K) with constant density profile would be mostly ionised by the GRB to N v out to a radius of r ≈ 10 pc. The indication of our results that N v only traces a small fraction of the ionised gas within the GRB host galaxy thus suggests that most of the ionised gas lies inside the region where N v is detected, where the gas would experience a greater level of photoionisation. The radius and density of the ionised cloud estimated by Prochaska et al. (2008) cannot account for the large column densities of ionised gas suggested by our X-ray measurements. However, both sets of observations may be satisfied by imposing a wind-density profile (n ∝ r2), such that a larger column of gas could be photoionised to very high states within a few parsecs of the GRB, while still maintaining a significant column of N v.
The recent surge in early-time photometric and spectroscopic data available in the Swift era of GRB observations has provided a significantly better handle on the conditions of the host galaxy material along the line-of-sight to a GRB, which will be complimented by future observations with XShooter at VLT. Observations of variability in the fine-structure lines of singly ionised elements, such as Si ii and Fe ii, are placing limits on the distance of the neutral absorbing gas (e.g Vreeswijk et al. 2007; Ledoux et al. 2009), and the detailed analysis of strong-ion absorption lines presented in Fox et al. (2008) and Prochaska et al. (2008) provide some of the first attempts at investigating the GRB circumburst environment.
From the broadband photometric and spectroscopic data presented in this paper we have been able to study the relation between the neutral and ionised gas within GRB host galaxies, providing greater insight into the affect a GRB has on its surrounding environment, and on the importance of the numerous absorption components on our observations. The lack of optical absorption lines at lower IPs leads us to conclude that either the large fraction of the ionised gas along the line-of-sight to the GRB is in an ultra-ionised state or that further consideration on our understanding of the absorption of the GRB optical and X-ray afterglow is needed. An ultra-ionised gas would produce a signature in the soft X-ray energy bands, where absorption from oxygen and carbon is already prominent. It will, however, require future, high-sensitivity X-ray spectroscopic missions such as Xenia to verify the presence and abundance of such highly ionised gas.
Fynbo et al. (2006) reports a tentative detection of H2 in the spectrum of GRB 060206. However, Tumlinson et al. (2007) later argued that the claimed H2 absorption lines are Lyα forest lines.
Assuming solar abundances from Anders & Grevesse (1989).
By default xspec uses the abundances from Anders & Grevesse (1989), which are consistent with those of Asplund et al. (2009) within errors. Variations in NH,X and NO,X measurements resulting from the use of different abundances are, therefore, negligible.
[X/Y] = log (NX/NY) − log (X/Y)⊙.
GRB 080607 also had a well-detected 2175 Å feature (Prochaska et al. 2009). However, only lower limits on the zinc and iron column densities are available for this GRB.
Acknowledgments
We thank the referee for the helpful comments. P. Schady acknowledges support through project SA 2001/2-1 of the DFG. S. Savaglio acknowledges support through project M.FE.A.Ext 00003 of the MPG. T. Krühler acknowledges support by the Deutsche Forschungsgemeinschaft (DFG) cluster of excellence Origin and Structure of the Universe. This research has made use of data obtained from the High Energy Astrophysics Science Archive Research Center (HEASARC), the UK Swift Science Data Centre at the University of Leicester and the Leicester Data base and Archive Service (LEDAS), provided by NASAs Goddard Space Flight Center and the Department of Physics and Astronomy, Leicester University, UK, respectively.
References
- Aoki, K., Totani, T., Hattori, T., et al. 2009, PASJ, 61, 387 [NASA ADS] [Google Scholar]
- Anders, E., & Grevesse, N. 1989, Geochim. Cosmochim. Acta, 53, 197 [Google Scholar]
- Arnaud, K. A. 1996, Astronomical Data Analysis Software and Systems V, 101, 17 [NASA ADS] [Google Scholar]
- Asplund, M., Grevesse, N., Sauval, A. J., & Scott, P. 2009, ARA&A, 47, 481 [NASA ADS] [CrossRef] [Google Scholar]
- Berger, E., Penprase, B. E., Cenko, S. B., et al. 2006, ApJ, 642, 979 [NASA ADS] [CrossRef] [Google Scholar]
- Burrows, D. N., Hill, J. E., Nousek, J. A., et al. 2005a, Space Sci. Rev., 120, 165 [NASA ADS] [CrossRef] [Google Scholar]
- Campana, S., Romano, P., Covino, S., et al. 2006, A&A, 449, 61 [NASA ADS] [CrossRef] [EDP Sciences] [Google Scholar]
- Campana, S., Thöne, C. C., de Ugarte Postigo, A., et al. 2010, MNRAS, 402, 2429 [NASA ADS] [CrossRef] [Google Scholar]
- Cenko, S. B., Kelemen, J., Harrison, F. A., et al. 2009, ApJ, 693, 1484 [NASA ADS] [CrossRef] [Google Scholar]
- Chary, R., Berger, E., & Cowie, L. 2007, ApJ, 671, 272 [NASA ADS] [CrossRef] [Google Scholar]
- D’Elia, V., Fiore, F., Perna, R., et al. 2009, A&A, 503, 437 [NASA ADS] [CrossRef] [EDP Sciences] [Google Scholar]
- D’Elia, V., Fynbo, J. P. U., Covino, S., et al. 2010, A&A, 523, A36 [NASA ADS] [CrossRef] [EDP Sciences] [Google Scholar]
- Draine, B. T. 2003, ApJ, 598, 1026 [NASA ADS] [CrossRef] [Google Scholar]
- Elíasdóttir, Á., Fynbo, J. P. U., Hjorth, J., et al. 2009, ApJ, 697, 1725 [NASA ADS] [CrossRef] [Google Scholar]
- Evans, P. A., Beardmore, A. P., Page, K. L., et al. 2009, MNRAS, 397, 1177 [NASA ADS] [CrossRef] [Google Scholar]
- Falcone, A. D., Morris, D., Racusin, J., et al. 2007, ApJ, 671, 1921 [NASA ADS] [CrossRef] [Google Scholar]
- Fox, A. J., Ledoux, C., Vreeswijk, P. M., Smette, A., & Jaunsen, A. O. 2008, A&A, 491, 189 [NASA ADS] [CrossRef] [EDP Sciences] [Google Scholar]
- Fruchter, A., Krolik, J. H., & Rhoads, J. E. 2001, ApJ, 563, 597 [NASA ADS] [CrossRef] [Google Scholar]
- Fruchter, A. S., Levan, A. J., Strolger, L., et al. 2006, Nature, 441, 463 [NASA ADS] [CrossRef] [PubMed] [Google Scholar]
- Fynbo, J. P. U., Starling, R. L. C., Ledoux, C., et al. 2006, A&A, 451, L47 [NASA ADS] [CrossRef] [EDP Sciences] [Google Scholar]
- Fynbo, J. P. U., Jakobsson, P., Prochaska, J. X., et al. 2009, ApJS, 185, 526 [NASA ADS] [CrossRef] [Google Scholar]
- Galama, T. J., & Wijers, R. A. M. J. 2001, ApJ, 549, L209 [NASA ADS] [CrossRef] [Google Scholar]
- Gehrels, N., Chincarini, G., Giommi, P., et al. 2004, ApJ, 611, 1005 [NASA ADS] [CrossRef] [Google Scholar]
- Greiner, J., Bornemann, W., Clemens, C., et al. 2008, PASP, 120, 405 [NASA ADS] [CrossRef] [Google Scholar]
- Greiner, J., Krühler, T., Fynbo, J. P. U., et al. 2009, ApJ, 693, 1610 [NASA ADS] [CrossRef] [Google Scholar]
- Greiner, J., Krühler, T., Klose, S., et al. 2010, A&A, in press [Google Scholar]
- Hjorth, J., Møller, P., Gorosabel, J., et al. 2003, ApJ, 597, 699 [NASA ADS] [CrossRef] [Google Scholar]
- Kalberla, P. M. W., Burton, W. B., Hartmann, D., et al. 2005, A& A, 440, 775 [CrossRef] [EDP Sciences] [Google Scholar]
- Kann, D. A., Klose, S., & Zeh, A. 2006, ApJ, 641, 993 [NASA ADS] [CrossRef] [Google Scholar]
- Kawai, N., Kosugi, G., Aoki, K., et al. 2006, Nature, 440, 184 [NASA ADS] [CrossRef] [PubMed] [Google Scholar]
- Kouveliotou, C., Meegan, C. A., Fishman, G. J., et al. 1993, ApJ, 413, L101 [NASA ADS] [CrossRef] [Google Scholar]
- Krühler, T., Küpcü Yoldaş, A., Greiner, J., et al. 2008, ApJ, 685, 376 [NASA ADS] [CrossRef] [Google Scholar]
- Küpcü Yoldaş, A., Greiner, J., & Perna, R. 2006, A&A, 457, 115 [NASA ADS] [CrossRef] [EDP Sciences] [Google Scholar]
- Küpcü-Yoldaş, A., Krühler, T., Greiner, J., et al. 2008, Am. Inst. Phys. Conf. Ser., 1000, 227 [Google Scholar]
- Ledoux, C., Vreeswijk, P. M., Smette, A., et al. 2009, A&A, 506, 661 [NASA ADS] [CrossRef] [EDP Sciences] [Google Scholar]
- Liang, E., & Zhang, B. 2006, ApJ, 638, L67 [NASA ADS] [CrossRef] [Google Scholar]
- Madau, P. 1995, ApJ, 441, 18 [NASA ADS] [CrossRef] [Google Scholar]
- Masetti, N., Palazzi, E., Pian, E., et al. 2003, A&A, 404, 465 [NASA ADS] [CrossRef] [EDP Sciences] [Google Scholar]
- McBreen, S., Krühler, T., Rau, A., et al. 2010, A&A, 516, A71 [NASA ADS] [CrossRef] [EDP Sciences] [Google Scholar]
- Nardini, M., Ghisellini, G., Ghirlanda, G., et al. 2006, A&A, 451, 821 [NASA ADS] [CrossRef] [EDP Sciences] [Google Scholar]
- Nardini, M., Ghisellini, G., & Ghirlanda, G. 2008, MNRAS, 386, L87 [NASA ADS] [CrossRef] [Google Scholar]
- Noll, S., Pierini, D., Pannella, M., & Savaglio, S. 2007, A&A, 472, 455 [NASA ADS] [CrossRef] [EDP Sciences] [Google Scholar]
- Nousek, J. A., Kouveliotou, C., Grupe, D., et al. 2006, ApJ, 642, 389 [NASA ADS] [CrossRef] [Google Scholar]
- O’Flaherty, K. S., & Jakobsen, P. 1997, ApJ, 479, 673 [NASA ADS] [CrossRef] [Google Scholar]
- Oates, S. R., Page, M. J., Schady, P., et al. 2009, MNRAS, 395, 490 [NASA ADS] [CrossRef] [Google Scholar]
- Pei, Y. C. 1992, ApJ, 395, 130 [NASA ADS] [CrossRef] [Google Scholar]
- Perley, D. A., Li, W., Chornock, R., et al. 2008a, ApJ, 688, 470 [NASA ADS] [CrossRef] [Google Scholar]
- Perley, D. A., Bloom, J. S., Butler, N. R., et al. 2008b, ApJ, 672, 449 [NASA ADS] [CrossRef] [Google Scholar]
- Perley, D. A., Cenko, S. B., Bloom, J. S., et al. 2009, AJ, 138, 1690 [NASA ADS] [CrossRef] [Google Scholar]
- Perna, R., & Lazzati, D. 2002, ApJ, 580, 261 [NASA ADS] [CrossRef] [Google Scholar]
- Perna, R., Raymond, J., & Loeb, A. 2000, ApJ, 533, 658 [NASA ADS] [CrossRef] [Google Scholar]
- Piro, L., Kouveliotou, C., den Herder, J., et al. 2010, BAAS, 41, 659 [NASA ADS] [Google Scholar]
- Price, P. A., Songaila, A., Cowie, L. L., et al. 2007, ApJ, 663, L57 [NASA ADS] [CrossRef] [Google Scholar]
- Piranomonte, S., Ward, P. A., Fiore, F., et al. 2008, A&A, 492, 775 [NASA ADS] [CrossRef] [EDP Sciences] [Google Scholar]
- Poole, T. S., Breeveld, A. A., Page, M. J., et al. 2008, MNRAS, 383, 627 [NASA ADS] [CrossRef] [Google Scholar]
- Prochaska, J. X. 2006, ApJ, 650, 272 [NASA ADS] [CrossRef] [MathSciNet] [Google Scholar]
- Prochaska, J. X., & Wolfe, A. M. 2002, ApJ, 566, 68 [NASA ADS] [CrossRef] [Google Scholar]
- Prochaska, J. X., Chen, H.-W., & Bloom, J. S. 2006, ApJ, 648, 95 [NASA ADS] [CrossRef] [Google Scholar]
- Prochaska, J. X., Chen, H.-W., Bloom, J. S., et al. 2007a, ApJS, 168, 231 [NASA ADS] [CrossRef] [Google Scholar]
- Prochaska, J. X., Chen, H.-W., Dessauges-Zavadsky, M., & Bloom, J. S. 2007b, ApJ, 666, 267 [NASA ADS] [CrossRef] [Google Scholar]
- Prochaska, J. X., Dessauges-Zavadsky, M., Ramirez-Ruiz, E., & Chen, H.-W. 2008, ApJ, 685, 344 [NASA ADS] [CrossRef] [Google Scholar]
- Prochaska, J. X., Chen, H.-W., Bloom, J. S., et al. 2009, ApJ, 691, L27 [NASA ADS] [CrossRef] [Google Scholar]
- Rau, A., Savaglio, S., Krühler, T., et al. 2010, ApJ, 720, 862 [NASA ADS] [CrossRef] [Google Scholar]
- Roming, P. W. A., Kennedy, T. E., Mason, K. O., et al. 2005, Space Sci. Rev., 120, 95 [NASA ADS] [CrossRef] [Google Scholar]
- Ruiz-Velasco, A. E., Swan, H., Troja, E., et al. 2007, ApJ, 669, 1 [NASA ADS] [CrossRef] [Google Scholar]
- Salvaterra, R., Della Valle, M., Campana, S., et al. 2009, Nature, 461, 1258 [NASA ADS] [CrossRef] [PubMed] [Google Scholar]
- Sari, R., Piran, T., & Narayan, R. 1998, ApJ, 497, L17 [NASA ADS] [CrossRef] [Google Scholar]
- Savage, B. D., & Sembach, K. R. 1991, ApJ, 379, 245 [NASA ADS] [CrossRef] [Google Scholar]
- Savage, B. D., & Sembach, K. R. 1996, ARA&A, 34, 279 [NASA ADS] [CrossRef] [Google Scholar]
- Savaglio, S., & Fall, S. M. 2004, ApJ, 614, 293 [NASA ADS] [CrossRef] [Google Scholar]
- Savaglio, S., Fall, S. M., & Fiore, F. 2003, ApJ, 585, 638 [NASA ADS] [CrossRef] [Google Scholar]
- Savaglio, S. 2006, New J. Phys., 8, 195 [NASA ADS] [CrossRef] [Google Scholar]
- Savaglio, S., Glazebrook, K., & Le Borgne, D. 2009, ApJ, 691, 182 [NASA ADS] [CrossRef] [MathSciNet] [Google Scholar]
- Schady, P., Mason, K. O., Page, M. J., et al. 2007, MNRAS, 377, 273 [NASA ADS] [CrossRef] [Google Scholar]
- Schady, P., Page, M. J., Oates, S. R., et al. 2010, MNRAS, 401, 2773 [NASA ADS] [CrossRef] [Google Scholar]
- Schlegel, D. J., Finkbeiner, D. P., & Davis, M. 1998, ApJ, 500, 525 [NASA ADS] [CrossRef] [Google Scholar]
- Shin, M.-S., et al. 2006, unpublished, [arXiv:astro-ph/0608327] [Google Scholar]
- Spitzer, L., Jr. 1978, Physical Processes in the Interstellar Medium (New York: Wiley) [Google Scholar]
- Starling, R. L. C., Wijers, R. A. M. J., Wiersema, K., et al. 2007, ApJ, 661, 787 [NASA ADS] [CrossRef] [Google Scholar]
- Starling, R. L. C., Rol, E., van der Horst, A. J., et al. 2009, MNRAS, 400, 90 [NASA ADS] [CrossRef] [Google Scholar]
- Stratta, G., Fiore, F., Antonelli, L. A., Piro, L., & De Pasquale, M. 2004, ApJ, 608, 846 [NASA ADS] [CrossRef] [Google Scholar]
- Klose, S., Greiner, J., Rau, A., et al. 2004, AJ, 128, 1942 [NASA ADS] [CrossRef] [Google Scholar]
- Tanvir, N. R., Fox, D. B., Levan, A. J., et al. 2009, Nature, 461, 1254 [NASA ADS] [CrossRef] [PubMed] [Google Scholar]
- Thöne, C. C., Wiersema, K., Ledoux, C., et al. 2008a, A&A, 489, 37 [NASA ADS] [CrossRef] [EDP Sciences] [Google Scholar]
- Thöne, C. C., Kann, D. A., Jóhannesson, G., et al. 2008b, [arXiv:0806.1182] [Google Scholar]
- Totani, T. 2006, PASJ, 58, 965 [NASA ADS] [Google Scholar]
- Tumlinson, J., Prochaska, J. X., Chen, H.-W., Dessauges-Zavadsky, M., & Bloom, J. S. 2007, ApJ, 668, 667 [NASA ADS] [CrossRef] [Google Scholar]
- van Paradijs, J., Groot, P. J., Galama, T., et al. 1997, Nature, 386, 686 [NASA ADS] [CrossRef] [Google Scholar]
- Verner, D. A., & Yakovlev, D. G. 1995, A&AS, 109, 125 [NASA ADS] [Google Scholar]
- Vreeswijk, P. M., Ellison, S. L., Ledoux, C., et al. 2004, A&A, 419, 927 [NASA ADS] [CrossRef] [EDP Sciences] [Google Scholar]
- Vreeswijk, P. M., Ledoux, C., Smette, A., et al. 2007, A&A, 468, 83 [NASA ADS] [CrossRef] [EDP Sciences] [Google Scholar]
- Watson, D., Fynbo, J. P. U., Ledoux, C., et al. 2006, ApJ, 652, 1011 [NASA ADS] [CrossRef] [Google Scholar]
- Watson, D., Hjorth, J., Fynbo, J. P. U., et al. 2007, ApJ, 660, L101 [NASA ADS] [CrossRef] [Google Scholar]
- Weingartner, J. C., & Draine, B. T. 2001, ApJ, 548, 296 [NASA ADS] [CrossRef] [Google Scholar]
- Zafar, T., Watson, D. J., Malesani, D., et al. 2010, A&A, 515, A94 [NASA ADS] [CrossRef] [EDP Sciences] [Google Scholar]
All Tables
All Figures
|
Fig. 1 Iron-to-zinc relative abundance, [Fe/Zn], as a function of the logarithmic Zn ii column density. GRB host galaxy measurements are plotted as solid circles, and a sample of QSOs taken from Savaglio (2006) (open circles) are plotted for comparison. The dashed line shows the ordinary least-squares (OLS) bisector fit to the combined GRB and QSO data, which has a power-law index of − 0.7. GRBs with limits on either Fe ii of Zn ii are plotted in grey with smaller symbols, as well as with up- and leftward pointing arrows, respectively. |
| In the text | |
|
Fig. 2 Iron-to-zinc relative abundance, [Fe/Zn], against visual extinction, AV, for a sample of 16 GRBs. GRBs with limits on either [Fe/Zn] or AV are plotted in grey with smaller symbols. |
| In the text | |
|
Fig. 3 Host-galaxy neutral gas column density, Nntr, against host-galaxy total gas column density, NN,O, along the line-of-sight to a sample of 26 GRBs. For each GRB, Nntr is derived from either the column density of Zn ii (red circles), S ii (orange squares), Si ii (green stars), or Fe ii (blue triangles), where a correction for dust depletion is applied to NN,Si and NN,Fe. Smaller data points correspond to those taken from low- or mid-resolution spectra, and larger data points are taken from high-resolution spectra (R > 10 000). The dashed line corresponds to where Nntr is equal to NN,O. |
| In the text | |
|
Fig. 4 Logarithmic host galaxy column density of the highly ionised atoms C iv, Si iv, N v, and O vi against the total logarithmic column densities of C, Si, N, and O in the top, second, third, and bottom panels, respectively. The total column densities are derived from X-ray observations, denoted by NX. The C iv, Si iv, N v, and O vi measurements plotted as circles are all taken from Fox et al. (2008), the N v data plotted as squares are from Prochaska et al. (2008), and data taken from D’Elia et al. (2010) are plotted as triangles. In all four panels, the dashed line corresponds to where the normalised soft X-ray column density is equal to the column density of the corresponding highly ionised atom. |
| In the text | |
|
Fig. 5 Ionisation profile of gas within the host galaxy of six GRBs as traced by nitrogen. Ionisation state of the gas is divided into three broad components; neutral (Nntr), highly ionised (NV), and ultra-ionised (Nultrion). Highly ionised nitrogen, N v, is measured directly from optical spectra, whereas the column density of neutral nitrogen is determined from either S ii (black circles) or Zn ii (grey circles), and the ultra-ionised column density of nitrogen gas is determined from X-ray measurements. The downward pointing triangle represents an upper-limit. |
| In the text | |
Current usage metrics show cumulative count of Article Views (full-text article views including HTML views, PDF and ePub downloads, according to the available data) and Abstracts Views on Vision4Press platform.
Data correspond to usage on the plateform after 2015. The current usage metrics is available 48-96 hours after online publication and is updated daily on week days.
Initial download of the metrics may take a while.