Fig. 1
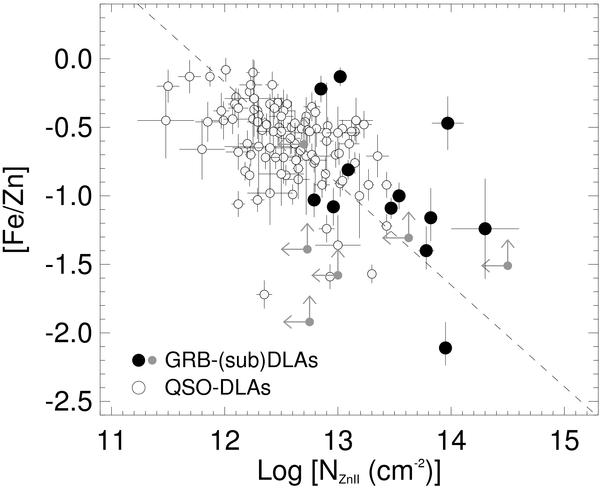
Iron-to-zinc relative abundance, [Fe/Zn], as a function of the logarithmic Zn ii column density. GRB host galaxy measurements are plotted as solid circles, and a sample of QSOs taken from Savaglio (2006) (open circles) are plotted for comparison. The dashed line shows the ordinary least-squares (OLS) bisector fit to the combined GRB and QSO data, which has a power-law index of − 0.7. GRBs with limits on either Fe ii of Zn ii are plotted in grey with smaller symbols, as well as with up- and leftward pointing arrows, respectively.
Current usage metrics show cumulative count of Article Views (full-text article views including HTML views, PDF and ePub downloads, according to the available data) and Abstracts Views on Vision4Press platform.
Data correspond to usage on the plateform after 2015. The current usage metrics is available 48-96 hours after online publication and is updated daily on week days.
Initial download of the metrics may take a while.