Free Access
Fig. 9
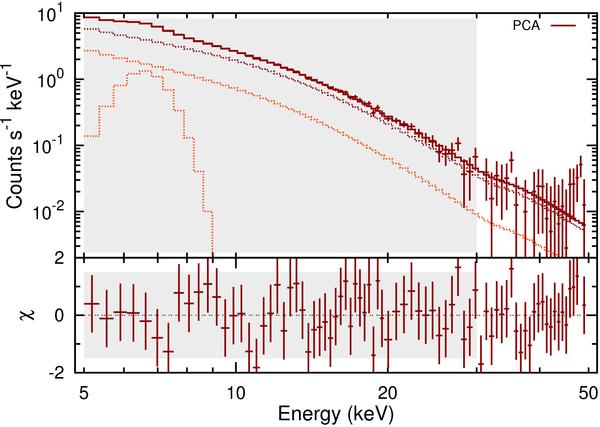
PCA spectrum and the best-fit model. In the upper panel, the best-fit model (thick brown solid line) is decomposed into the G21.5–0.9 (brown dotted line) and the unrelated (orange dotted line) emission components. The other symbols follow Fig. 5.
Current usage metrics show cumulative count of Article Views (full-text article views including HTML views, PDF and ePub downloads, according to the available data) and Abstracts Views on Vision4Press platform.
Data correspond to usage on the plateform after 2015. The current usage metrics is available 48-96 hours after online publication and is updated daily on week days.
Initial download of the metrics may take a while.