Fig. 6
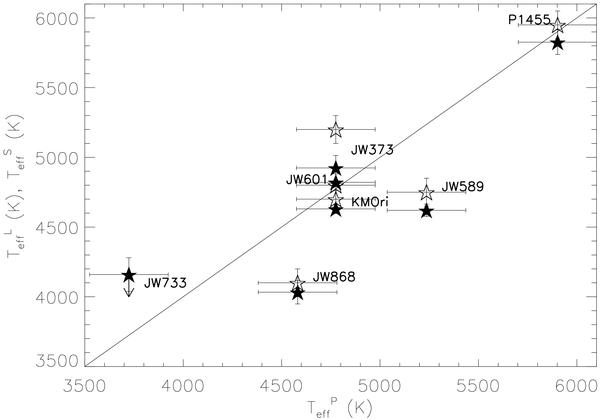
Spectroscopic effective temperatures versus the photometric values obtained by Hillenbrand (1997). Our  and
and  values obtained using the LDR method and MOOG code are shown as filled and empty stars, respectively. The arrow represents an upper limit. The error bars on the x-axis refer to the values given by Hillenbrand (1997), while those on the y-axis refer to the uncertainties in only, while typical uncertainties in are 60 K (see text).
Current usage metrics show cumulative count of Article Views (full-text article views including HTML views, PDF and ePub downloads, according to the available data) and Abstracts Views on Vision4Press platform.
Data correspond to usage on the plateform after 2015. The current usage metrics is available 48-96 hours after online publication and is updated daily on week days.
Initial download of the metrics may take a while.