Fig. 5
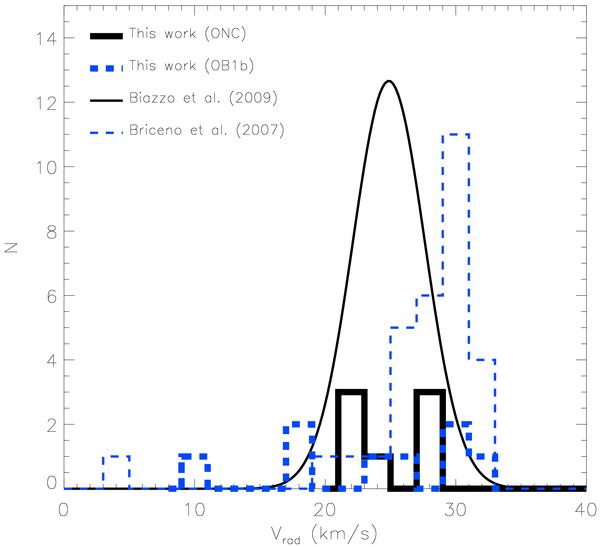
Radial velocity distribution for the most probable single stars in the ONC (solid lines) and OB1b (dashed lines) samples. The thick solid and dashed lines refer to this work. The thin solid line represents the Gaussian fit to the Biazzo et al. (2009) sample obtained for 96 ONC targets with a mean Vrad = 24.87 km s-1 ( km s-1). The thin dashed line represents the histogram obtained by Briceño et al. (2007) for 30 OB1b stars with mean Vrad = 30.1 ± 1.9 km s-1.
Current usage metrics show cumulative count of Article Views (full-text article views including HTML views, PDF and ePub downloads, according to the available data) and Abstracts Views on Vision4Press platform.
Data correspond to usage on the plateform after 2015. The current usage metrics is available 48-96 hours after online publication and is updated daily on week days.
Initial download of the metrics may take a while.