Free Access
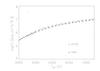
Fig. B.2
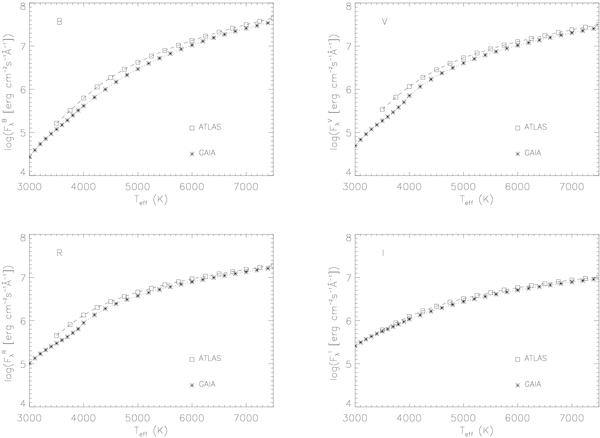
Comparison between continuum flux at the Johnson BVRI-bands obtained with ATLAS spectra (squares and dashed line) and GAIA spectra (asterisks and dotted line) at log g = 4.0 as a function of Teff. The lines represent an interpolation through the points.
This figure is made of several images, please see below:
Current usage metrics show cumulative count of Article Views (full-text article views including HTML views, PDF and ePub downloads, according to the available data) and Abstracts Views on Vision4Press platform.
Data correspond to usage on the plateform after 2015. The current usage metrics is available 48-96 hours after online publication and is updated daily on week days.
Initial download of the metrics may take a while.