Fig. 10
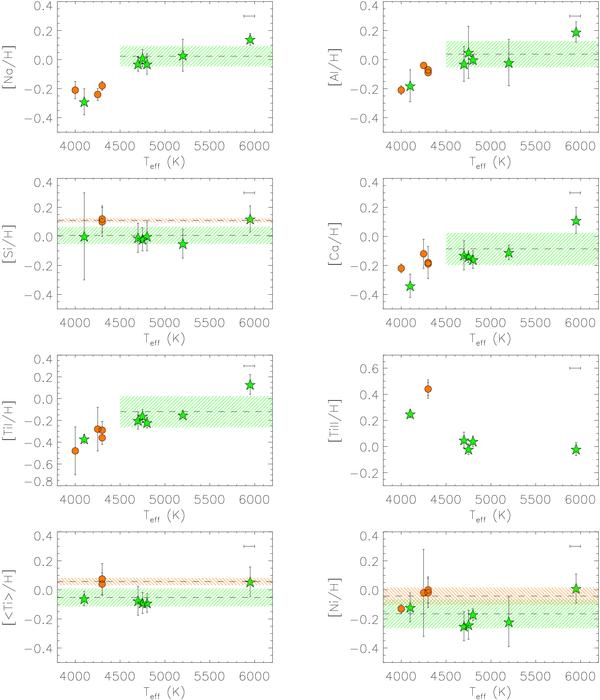
[X/H] versus  . Stars and circles represent ONC and OB1b targets, respectively. Mean ONC and OB1b values and ± 1σ bars are shown as dashed areas, 45° and 215° oriented, respectively. For the Na, Al, Ca, and Ti abundances, we show the mean values obtained from all the ONC targets with
  K, while for the Si, Ni, and mean Ti abundances the average was computed considering all the ONC/OB1b stars. The horizontal error bar in all plots represents the typical uncertainty in .
Current usage metrics show cumulative count of Article Views (full-text article views including HTML views, PDF and ePub downloads, according to the available data) and Abstracts Views on Vision4Press platform.
Data correspond to usage on the plateform after 2015. The current usage metrics is available 48-96 hours after online publication and is updated daily on week days.
Initial download of the metrics may take a while.